
What is the Smart Factory?
The Smart Factory is a suite of modern digital applications that deliver solutions for reliability, efficiency, and profitability. The Smart Factory method aims to connect people, processes, and assets within the organization much better than what has been done with traditional digital solutions. The Smart Factory becomes a reality because of advent of new technology available, which include IIoT, cloud/edge computing, data analytics, virtual reality, and digitalization for integrated workflows.
The Smart Factory intends to address a critical issue with existing practice: key activities and data are in silos and thus unable to convert data into actions in a systematic and timely manner. The key activities include supply chain management, production monitoring and optimization, distributed control system (DCS), asset management and maintenance. In other words, all of these systems generate a lot of data, making it practically impossible for site engineers to gather, correlate, and analyze data in a timely manner to predict operating issues and equipment failures to come up effective actions for prevention and optimization.
The Smart Factory is more than just data collection and software tools. It is about integrating new digital solutions with existing data infrastructure. It is about better management of asset, workflows, and knowledge. The Smart Factory creates value through real‐time data monitoring, models, and optimization to reveal new insights for opportunities, leading to turn‐key solutions. It also applies advanced analytics and machine learning (ML) techniques to develop new heuristics and enable the solving of issues that we were previously unable to.
It leverages the long‐standing experience, paired with new digital technologies to resolve operating issues better, faster consistently. Use of the Smart Factory method can result in faster detection and resolution of operating problems as well as more effective best knowledge sharing and management.
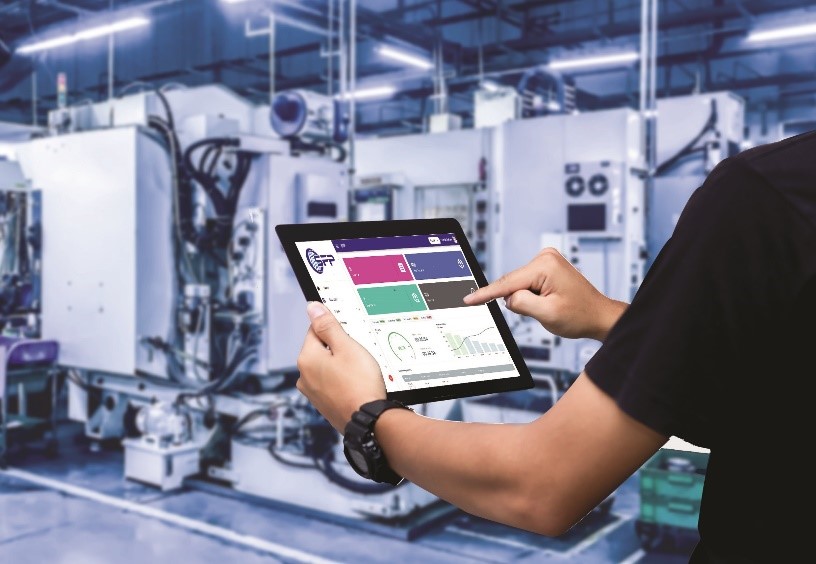
Picture1. Graphical status of the Smart Factory
The history of the Smart Factory
The Smart Factory is a part of the technological transformation known as Industry 4.0 or the Fourth Industrial Revolution. Each of the first three industrial revolutions was born out of an innovative new technology that completely changed the way we worked and manufactured goods; Namely, the steam engine, the assembly line, and the power of the computer. Today, the fourth revolution is driven by digital transformation and intelligent automation.
Industry 4.0 has reinvented how businesses design, manufacture, and distribute their products. Technologies such as Industrial Internet of Things (IIoT), cloud connectivity, AI, and machine learning are now deeply woven into the manufacturing process. This unified and integrated approach to manufacturing results in products, factories, and assets that are connected and intelligent. Today’s Industry 4.0 initiatives also look to develop symbiotic and rewarding collaborations between people and technology. When the accuracy and speed of 4.0 tools comes together with the creativity, talent, and innovation of your people, you get a win/win for both your human resources and your bottom line. Your manufacturing operations become more efficient and productive, and your teams are relieved of a lot of repetitive tasks – giving them the opportunity to collaborate with smart technologies and better equip themselves for the evolving technological landscape and the AI-powered future of work.
Since the 1800s, we have experienced three industrial revolutions. They were called “revolutions” because the innovation that drove them didn’t just slightly improve productivity and efficiency – it completely revolutionized how goods were produced and how work was done. We are now in the Fourth Industrial Revolution (Industry 4.0).
First industrial revolution
By the early 1800s, the First Industrial Revolution was underway. The invention of the steam engine reduced industrial reliance on animal and human labor, ushering in a new age of manufacturing and precision engineering.
Second industrial revolution
A century later, the growing use of petroleum and electric power meant that machinery could be leaner and less cumbersome. The Second Industrial Revolution was driven by the assembly line and mass production processes, many of which are still in use today.
Third industrial revolution
Around the middle of the 20th century, computers hit the scene. The Third Industrial Revolution saw the early development of factory automation and robotics. This era also saw the first use of computerized business systems that were built to manage and analyze data.
Fourth industrial revolution
Today, manufacturing is increasingly powered by information. Vast amounts of data come from across the business and around the world, in real time, around the clock. AI is at the heart of the Fourth Industrial Revolution, allowing manufacturers to not only gather all that data but use it – to analyze, predict, understand, and report. Industry 4.0 is not characterized by a single technology. It is defined by the seamless integration of a number of systems, tools, and innovations.
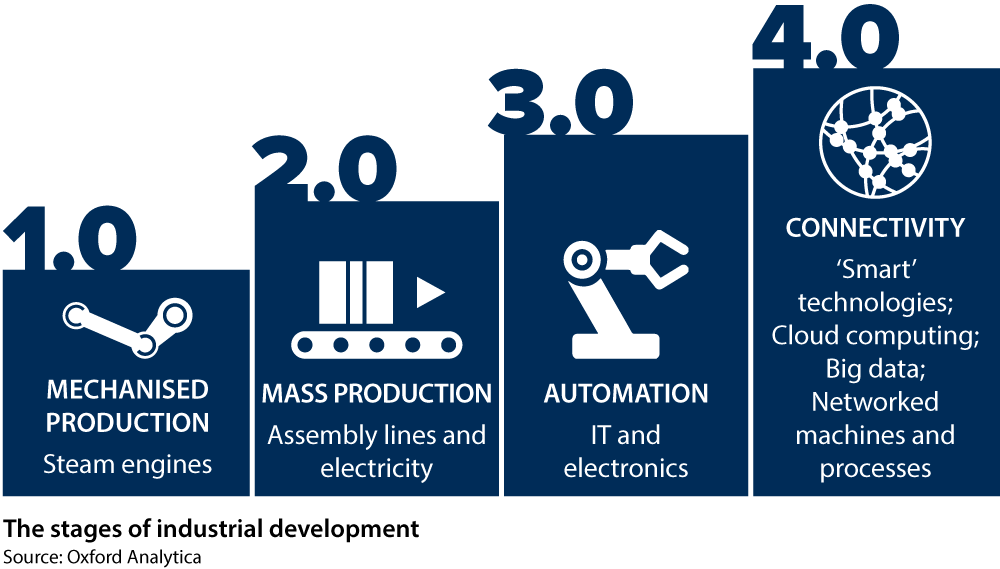
Picture2. Graphical display of the history of the smart factory
Major targets of the Smart Factory
In order to identify and prioritize opportunities along the digital thread, the Smart Factory method focuses on optimality, reliability, and human capital. For each of these value drivers, the Smart Factory connects the factory operations to the key financial parameters, resulting in a framework that companies can leverage to systematically identify weaknesses and take actions to resolve them and make more benefits.
Reliability enhancement
The Smart Factory offers reliability monitoring that includes process models and fault models. This solution provides early detection of process and equipment issues and includes troubleshooting recommendations to resolve these issues before they become costly. Through the dashboard, recommendations are shown in a clear and timely manner to deliver improved learning to customers’ organizations. For example, tracking solutions for root causes of low efficiency in mass production lines.
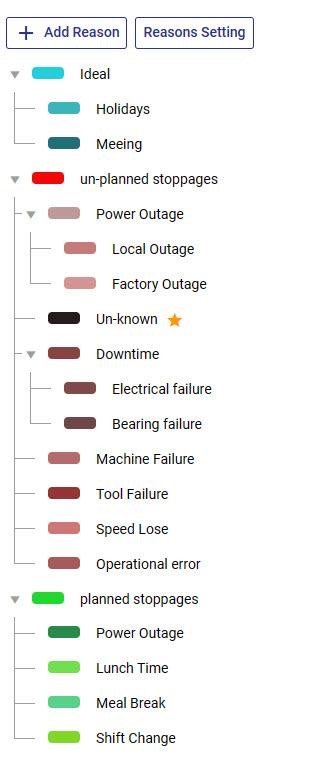
Picture3. The Smart Factory dashboard
Integrated Energy and Process Optimization
The process optimization service, as an important part of the Smart Factory, rigorously simulates an entire complex of process units to determine the maximum profitability of the complex, given current constraints and market conditions. Process optimization is about improving a process in terms of material consumption, energy use, yield optimization and finding best strategy for planning product lines is called planning optimization.
Asset Performance Management
The Smart Factory includes asset performance management (APM), which goes beyond traditional machine monitoring and data gathering. By merging together decades of machine modeling experience with modern analytics, the APM digital predict machinery availability, drill to the root causes of inefficient machine operation, and bring order to reliability and maintenance.
Profit Performance Optimization for the Total Site
The Smart Factory includes site‐wide performance monitoring. It provides visibility into the economic consequences of process performance as cost of lost opportunity and ensures sustainable benefits over varying operating conditions, visualizing real‐time unit profitability.
Challenges & opportunities for the Smart Factory
Environmental, quality, and safety regulations are becoming ever stricter. In today’s competitive environment, process plants are under more pressure than ever to deliver improved operating performance. Making the things even more challenging, the workforce is evolving, as an information technology (IT) savvy, but less experienced generation moves into roles once held by industry veterans, who have retired or are looking to retire. These trends are making the industrial norms to be rewritten, affecting profitability, reliability, and safety. Thus, the industry is at a turning point. The answer lies in the digital transformation. The experience demonstrates that digitalization can turn a distracted organization which is bogged down in reacting to day‐to‐day issues into an agile, well‐oiled machine that proactively anticipates issues and organizes to prioritize and solve them before they escalate.
Thus, industrial companies need digital solutions to integrate different data sources with advanced analytics to make decisions in near real time to run their production processes more efficiently. More importantly, digitalization aims to create new value beyond digitization by enhancing companies’ business capabilities and achieving operation excellence across the entire operation value chains. For most industrial plants, mere Industrial Internet of Things (IIoT) deployment is no longer a competitive advantage without understanding the implications of these insights. These advantages could be anything from improving safety to productivity to operational efficiency to workflow integration and automation. This is the part where true business outcome is delivered.
To achieve the best digitalization outcome, it requires optimal integration of IT, operation technology (OT), engineering technology (ET), and data technology (DT). IT consists of computers, networking devices, and other devices to generate, process, store, secure, and exchange all forms of electronic data. OT mainly includes industrial sensors and control systems, while ET comprises process models simulation and optimization and best practices for operation. DT consists of data analytics and machine learning (ML) technology. This integration of IT/OT/ET/DT creates significant value for companies and will lead to new business opportunities and growth.
Operation activities in a process plant
Process operation activities can be represented as a hierarchy (Figure 1.1). The foundation of the structure is composed of field devices (Level 1) such as sensors, transmitters, actuators, and valves that measure process variables such as flows, compositions, temperatures, and pressures, which are required for any industrial control system. The next level (Level 2) consists of regulatory controllers, which maintain measured values within specified limits. Process control plays a key role in ensuring process safety and protecting personnel, equipment, and the environment (Level 3). While regulatory controllers tackle each variable individually, the advanced process control such as multivariable and constraint controllers (Level 4) evaluates multiple variables simultaneously and enables an entire process unit close to a set of limiting constraints. To determine the optimum set points for a set of controllers, real‐time optimization (Level 5) is employed, which also consider advanced control strategies beyond control modules, process supervision and coordination, shutdowns and start‐ups, reliability and safety management, maintenance scheduling, etc. At Level 6, enterprise management involves organizing and coordinating the operations of multiple plants. This level is the highest in the plant hierarchy and handles various functions including feed purchasing, production planning, scheduling, optimization procedures relevant to general production planning, coordination between different plants, feed movement and product delivery, etc.
The successful implementation of these six‐level activities is a critical factor in making plant operation as profitable and reliable as possible. Levels 1, 2, and 3 are required for all process plants while the activities in Levels 4, 5, and 6 are designed for maximizing profit. The frequency of execution is much lower for higher‐level activities, and the time scale of each activity increases up the hierarchy from less than a second to days and months. This is due to the need of production change cycle as well as the increase in computational requirements and analysis time from the lowest level to the highest. These activities are related and should be carefully coordinated. Levels 4 and 5, which focus on the control functions of advanced process control and real‐time optimization for a process plant, are especially beneficial for a plant’s operations. In the above six levels, each layer depends on the previous layer in the hierarchy, and the control performance of an individual layer directly affects the stability of the process, the quality of the product, and the costs associated with making the product. However, running a single unit at its local optimum is not necessarily the best strategy for achieving overall profitability of the facility. This is where the production management layer steps in to manage the individual units’ APCs in concert to accomplish plant‐wide optimization. Furthermore, enterprise management coordinates multiple plant operations via optimizing feed selection and product generation and delivery to the market. That is where global optimum can be achieved for a company as a whole. In general, SFP (Smart Factory Planning) will enable you to manage most of above levels in an integrated way.
FIGURE1. Six‐level hierarchy for process control and optimization
- Major Challenges
- Supply Chain Management
In today’s business environment, a lack of agility can hinder an organization’s ability to be competitive. With high capital costs and ever‐increasing energy expenditures, an organization can become locked into patterns where it is implementing shortsighted, cost‐cutting measures that can adversely affect operational productivity—decreasing overall market responsiveness. The bottom line is: maintaining a big picture view of key metrics—such as selecting and purchasing cheap raw materials and increasing manufacturing throughput, as well as transportations and logistics accuracy—helps minimize overall costs. This is done by optimizing the whole supply chain including business and production planning and operation scheduling of production processes, which plays key roles in the search for better profits. Consider the oil refining sectors as an example. The supply chain of an integrated oil company stretches from the production and purchasing of crude oil to customers buying petrochemical products or fuel for heating or transport. Industrial supply chain consists of feed purchasing, delivery, feed mixing and scheduling, operation, and control.
The management of such enterprise involves making decisions on
- What feed to buy and where and when?
- What processes to operate and how?
- What products to make?
- When each product is blended to make on‐spec product to sell?
- What maintenance schedule for key equipment?
- How to integrate refining and petrochemical production?
These decisions will be made repeatedly when demands and supplies change, production upsets occur, and transportation logistics change. A typical medium refinery may make products worth around $10million/day. The difference in profit margin between best and worst supply chain management could be at least around $1/barrel, which is amount to $100,000/day for a refinery of 100,000 barrel/day capacity. The value for the gap is very significant. Thus, refineries strive to optimize operation effectively via digital systems in order to close the gap and capture the opportunity. SFP let you manage and optimize your supply chain system with MRP main feature which are located on the SFP, for implementing in any factory need to be Customized.
Process Efficiency Improvement
The best process efficiency consists of three components: consumption rate, design efficiency, and operation efficiency.
Consumption rate is the efficient use of raw materials. To get the best consumption rate, the key is to select the most cost‐effective raw materials.
Design efficiency is about achieving the best technology selection and process configurations to obtain optimal system designs featuring low capital and operating costs. Process integration and intensification is the key enabler to achieve high design efficiency.
Operation efficiency is how the teams operate the processes with high economic profit and minimum energy consumption via optimizing process conditions and better control. Integrated process optimization and control is the key enabler to achieve high operation efficiency.
SFP strived to use the newest and the most academic approaches to enhance the level of efficiency with OEE and MRP Indexes which are the best KPIs to increase efficiency.
Asset Management
In manufacturing, what is more crucial than the equipment itself? It is downtime, which damages business and costly for manufacturers. That is the reason why asset managers try their best to keep their equipment performing, despite constrained budgets and aging infrastructure. That is why equipment availability is one of the most important metrics for asset management. Yet many organizations lack the insight and visibility they need to proactively refine their operations in a cost‐effective way. In fact, many organizations struggle to establish a benchmark from which to build an asset management strategy based on the basic information. Such information might include:
- Do we have a register of assets down to a significant level?
- Do we know the physical location of these assets?
- Do we know how many?
- Do we know the condition of the assets?
- Do we know, or are we able to report in the future, the life cycle costs?
- Have we assessed and determined a risk profile for these assets?
In industrial and production settings, Total Preventative Maintenance (TPM) is a critical strategy for maintaining equipment and machines. By following a TPM program, organizations can reduce downtime, increase efficiency, and improve safety.
Digital solutions for Total Preventative Maintenance can reduce costs even as they reduce risk. Total preventative maintenance can analyze patterns, provide early warning signs for equipment failure, and respond with greater agility. This strategy can also perform at higher levels of reliability, quality, and safety without needing more resource. By using SFP (Smart Factory Planning), you will be able to ensure that your equipment and machines are at the highest level of efficiency and performance, because with SFP, you will be able to implement Total Preventive Maintenance (TPM) strategy and calculate the OEE index.
Picture4. Asset management
Workflows Integration and Automation
The missing ingredient in order to achieve business outcomes is an organizational culture of excellence implying operating workflows and best practices—the more that these tasks are automated, the more repeatable the outcome. If a start‐up or shutdown procedure can be automated, experience shows that the number of unsafe and costly incidents is reduced. Our digitalization philosophy is for our customers to wisely invest in automation to mitigate the risks through good digital tool design practices and supervision. SFP helps companies to visualize their workflows and to build their organizational culture among their staff.
Methodology of the Smart Factory (Connected Plant)
To overcome the above challenges, the Smart Factory methodology was developed (Edwards, 2016). This methodology aims to connect people, processes, and assets within the organization much better than what has been doing with traditional digital solutions. The Smart Factory wants to achieve the following outcome for customers:
- Every day is your best day of production.
- Everyone in your organization is a leading expert.
- Can maximize the overall profit based on the market conditions and asset capability.
- Can maximize asset utilization via predicting and correcting abnormal situations.
- Can make the company be the best in the industry.
The Smart Factory is more than just data collection and software tools. It is about applying intelligent models to reveal insights. It is about integrating new digital solutions with existing data infrastructure. It is about better management of asset, workflows, and knowledge via digital solutions. Industrial plants can benefit from being connected since they typically operate below their optimum output capacity due to process variations, unplanned downtime, and inconsistent workforce competency. Reaching and sustaining optimum levels of plant performance requires the transformation of real‐time data into actionable insights. This will allow processes to operate at optimum levels for longer periods of time, identify and resolve asset issues before unplanned outages, and help every worker to operate as an industry leading expert. A Smart Factory is a single pane of glass software solution that collects real‐time data and runs it through a digital plant model to predict and control deviations leading to optimized plant performance. By using our Smart Factory software, in addition to data collection and visual display of workflows, your organization can optimize the efficiency of your machines and find the most ideal time points for ordering and reduce the costs of your company drastically.
Process Data Overview
Process data often include process variables, quality data, and measured disturbances. These variables are often connected by the process flows and controller feedback, making them highly interactive and dynamic. Process data are measured at rather fast sampling rates, which can go from seconds to minutes for online measurement and control‐related variables.
Numerical Data
This is the most common data type. Basically, it represents some quantifiable thing that can be measured. Four major measurements are flow rate, temperature, pressure, and level:
- Temperature measurement devices such as thermocouples and resistant temperature detectors are the most common instruments found in industrial plans.
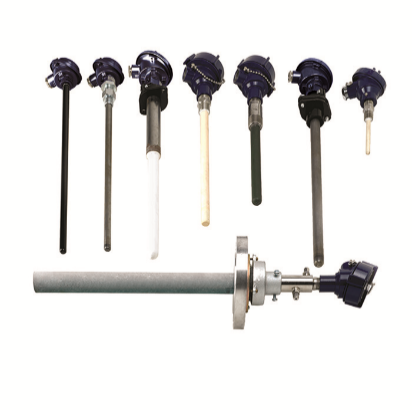
Picture5. Thermocouples
- Pressure transmitters are another common instrument in the form of differential pressure (DP) between one process connection and a reference pressure (e.g., atmosphere) or another process connection. DP transmitters are used to infer other process variables, such as flow and level.
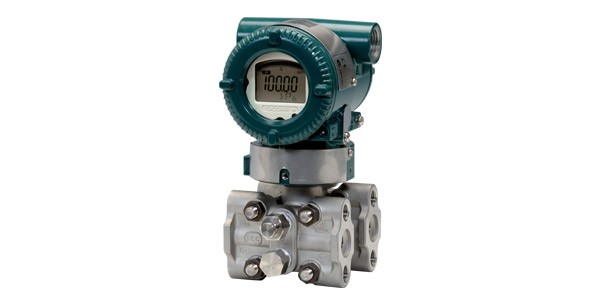
Picture6. differential pressure (DP)
- Flow measurements. Flow rates can be calculated from DP measurement. Volumetric flow can be calculated from the velocity. Mass flow rate can be calculated from the density of the material. Accurate flow measurements are essential for regulatory and APC (Advanced Process Control systems) applications.
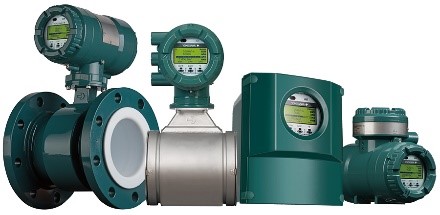
Picture7. Some kinds of flowmeter
- Level measurements. The level or height of materials in a vessel can be measured directly in some cases, but DP transmitters are commonly used to infer level as a function of hydrostatic pressure and density of the material.

Picture8. Hydrostatic level measurement
Beyond single‐point measurements, time series measurement data is another common data type in process industry. Usually, this kind of data is acquired on a regular time interval.
Analyzer Data
Process analyzers are integral parts of many APC (Advanced Process Control systems) applications. They come in a variety of types and process specific configurations. For example, an analyzer may provide continuous results or update intermittently and measure a property or composition of a stream.
Picture9. Process Analyzer
Engineering Data
In chemical process issues, inferential or soft sensors are used to calculate. Once the data is converted to desired format, soft sensors, engineering calculations, and process simulation become analytical building blocks for assisting plant operation, which helps to identify patterns of operation and predict optimal conditions and failure operating modes.
It is the analytical features rather than the raw data itself that become the starting point for statistic modeling and/or ML algorithms. In many cases, well‐crafted and well‐engineered features may well become the data quality benchmarking basis for data analytics applications.
Connected Measurement
Process control requires accurate, responsive, and maintainable measurements. Within industry, the top four measurements are flow, pressure, temperature, and level. Each of these individual measurements may be connected in a digital transformation project that has the aim to bring new insight to the end user, realizing a valuable outcome not previously available. However, for this chapter, the focus is on flow measurement.
The industrial processes and plants must operate not only at desired capacity but also at optimal efficiency and safety; Safety that enables a system to predict undesirable process or plant conditions and equipment failures before they occur and efficiency that systematically addresses the metering as part of the continuous improvement process. A growing number of metering asset owners seek to demonstrate the power of the Industrial Internet of Things (“IIoT”) to improve overall operational and business performance.
This chapter describes how the Smart Factory, often referred to as the IIoT, can support continuous improvement and solve previously unsolved problems to increase meter availability and its operational performance, safety, and reliability while maintaining its desired accuracy. By taking advantage of streaming data from sensors to rapidly assess operational status, a digital system can identify potential warning signs, deliver alerts, and automatically trigger actions.
The History of Metering: Metering Supervisory Systems
As the flow meter technologies developed, the approach “Supervisory Systems” also developed where Supervisory is defined as “observing and directing an activity or a person.”
Prior to the evolution of the electronic computer, most of the installed meters’ data was connected to chart recorders with local data collection by human operators. These paper charts and subsequent operatives’ notes were dispatched to a central facility where the information was processed in terms of “measurement custody transfer” and “operations” reports. The main challenge here was that the centralized facility had to process reports based on inputs. Most of the early remote terminal unit (“RTU”) and supervisory control and data acquisition (“SCADA”) systems had a limited capability in terms of signal input/output (“I/O”) and subsequent processing.
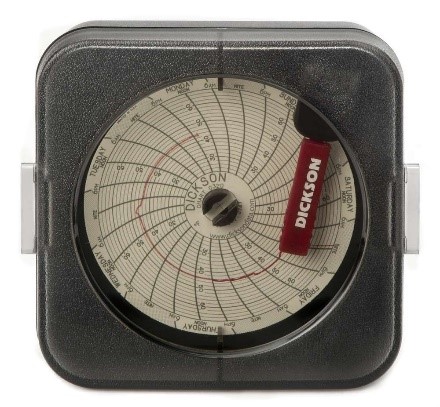
Picture10. Chart Recorder
The early 1970s saw what was to become the microprocessor. By 1975 the first dedicated flow computer (“FC”) was commercially. The essential inputs are flow (volume or mass), pressure, temperature, and often density or fluid composition as seen in the following figure. The critical outputs are bulk flow rate and the integrated totalization over predefined periods of time from 1 to 24 hour, recording any notified alarms and any mismeasurement events.
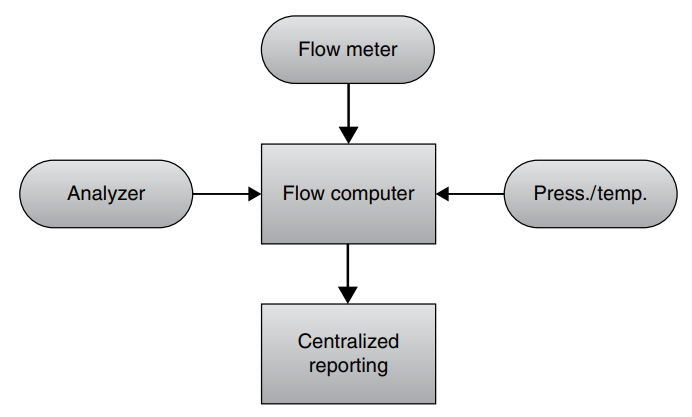
Figure2: Early single‐stream flow computer
Through the 1980s and 1990s, the universal multifunction controllers began to appear where there could be said to have been an overlap between the early Programmable Logic Controller (“PLC”) capabilities and the traditional Flow Computer (FC), but the main issue was that the measurement engineers were not control systems engineers working with PLC. At this point in time, a demarcation was created between the dedicated measurement systems engineers and the control systems engineers. This demarcation has continued to exist within the industry to this present day.
The metering supervisory computer (“MSC”) came into commercial operation as the number of FCs and flow meters grew to see a typical metering system. The MSC grew from the requirement to enable a greater communications network as well as computing power with its associated memory to implement advanced features across the total measurements system; ironically, these solutions have evolved into ever more powerful traditional SCADA (supervisory control and data acquisition) control systems!
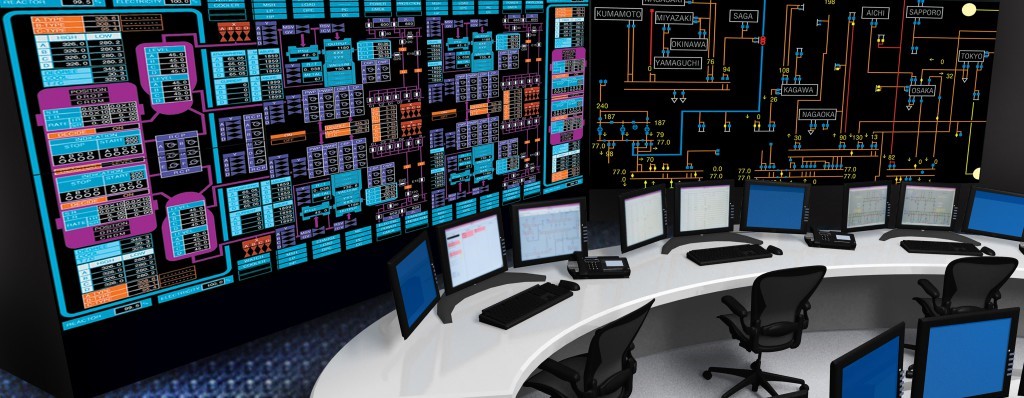
Picture11. SCADA (supervisory control and data acquisition) control systems
A typical overview of an MSC system is provided in the following figure.
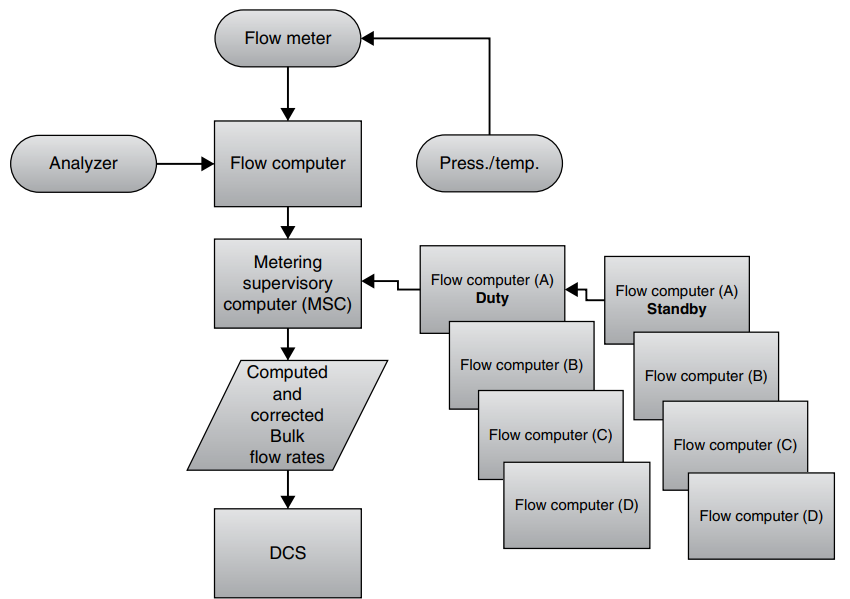
Figure3: Traditionally connected flow meter and the metering supervisory computer
In summary, the metering supervisory computer has existed for decades and may be regarded as a dedicated SCADA system for the metering engineers. The key change being highlighted in this chapter is in the connected digital transformation of these established technologies and not the fundamental metering technology itself. It is about the inherent digitization of a meter technology and its ability to relate to a larger system context to bring about new insightful outcomes.

Picture12. Programmable Logic Controller (PLC)
The History of Metering Diagnostics and Condition‐Based Monitoring (CBM)
As the flow meters developed, so too did the ability to diagnose operational faults being largely based on the commercialization of the personal computer and ever‐evolving generic software such as mathematical‐based spreadsheets. As the software developed and the computing power grew exponentially, more complex analyses were performed on operational metering assets. Complexity encompassed not only the meter itself but also other associated devices that comprised the larger measurement ecosystem. Developments continued over several decades with a huge digital transformation enabler being the dual technologies of cloud computing and open‐source frameworks for performing analysis on near‐real‐time collected, streamed data.
Meter diagnostics and condition‐based monitoring is digitization using physical computers generating analytical data to improve our knowledge and the maintenance of meter assets while better engaging people through the “automation of knowledge.”
A meter’s diagnostics is a method that is used for reporting the original design tolerances against an operational meter’s fault or failure enabling the end user to identify why it has failed.
A meter’s CBM system is the process of monitoring parameters of condition within a meter, its associated devices (e.g. pressure transmitter, temperature transmitter, quality analyzer, etc.) and the local in situ environment for the meter in order to identify a significant change that is indicative of a developing fault. It is a major component of predictive maintenance and is, therefore, enabling an end user to identify what is going to fail at a future and predetermined time. Predictive maintenance is time series data that includes a timestamp, a set of device readings collected at the same time as timestamps, and device identifiers. The goal of predictive maintenance is to predict at the time “t,” using the data up to that time, whether the equipment will fail in some specified period.
Why connected metering?
Connectivity in this setting is that enabled by the Smart Factory. The traditional installed‐base meters are great potentials for the automation‐of‐maintenance agenda. Automation through online self‐diagnostics brings about “CBM” analytics that have been utilized to extend the traditional recalibration frequency of ultrasonic meters, a unified approach toward maintaining meter accuracy and reliability. Such an approach has been actively pursued within the industry for the past two decades and pursued with great success. With the advancement in technologies, it is now possible to connect differential‐pressure devices, Coriolis meters, and turbine meters to highlight only three other technologies and even analytical devices such as the gas chromatograph. The ever‐advancing Smart Factory is the IIoT that is simply the “Intelligent Interconnection for Operational Transformation” that starts with the “BIG WHY’S” and not the “What.”
Firstly, know why there is a clear need to connect and, subsequently, why is that connectivity going to transform and improve operations! Once the “Why’s” are identified, the “How’s” become a little more intuitive or, at least, more readily definable when it is clear “What” already exists. The Smart Factory toward connected metering is not a rip‐and‐replace strategy but one based on ubiquitous connectivity within an evolving digital ecosystem. The first why is to connect the installed base of various metering types to leverage the technical advances historically seen with ultrasonic meters toward diagnostics and CBM. Advances that have reduced the traditional recalibration frequency while providing an online CBM facility to highlight when the meter is likely to drift outside its stated design performance or is trending toward failure. A strategic choice that moves away from the manual preventative maintenance “calendar” schedules toward online self‐monitoring 24/7/365. The IIoT, the Smart Factory, must provide a positive‐financial impact to enable its rollout, and it must deliver capability that was not previously possible. The greatest saving shall arise from subsequent data analytics that are only enabled by the Smart Factory.
Secondly, why is to enable data analytics not previously possible to bring about new capability to yield a significant positive‐financial saving, the enabler being the IIoT’s complex mesh framework with multiple data paths where subsequent advanced analytics shall be performed in multiple places in providing a technically auditable measurement. To further go beyond the traditional CBM approach, the advanced analytics will enable a near‐real‐time uncertainty analysis of a meter to determine its performance with respect to its uncertainty and the combined uncertainty of the overall metering system itself. The greatest negative‐financial impact for any metering asset is its lack of online CBM with its associated near‐real time uncertainty and not its extended recalibration frequency! To be able to connect the meter and its associated CBM with a near‐real‐time uncertainty is a challenge for the industry for which the author proposes the solution to be the Smart Factory by way of the IIOT.
Unique attributes of process data analytics
There are four important and unique attributes of process data attributes discussed:
- Working compatibly with first principles or process knowledge;
- Applying mathematical programming models for profit optimization;
- Dealing effectively with uncertainties that are usually time varying;
- Generating interpretable solutions.
Chemical processes are designed via applying first principles based on chemistry and physics. First principal models are largely represented by differential and algebraic equations (DAEs). These models become the basis for process simulations, optimization, and control. To achieve economic targets while observing reliable and safe operation, mathematical programming methods such as linear (LP), nonlinear (NLP), and mixed integer linear programing (MILP) have been applied widely. These methods use an objective function for profit maximization and constraints for reliability and safety. Industrial process operations are like a coin with two sides.
On one side are the first principle and optimization models, which are so‐called white models because the modeling equations used can clearly describe technical and economic relationships. Uncertainties are the other side of the coin; they are everywhere in industrial operations and control and are time varying and dynamically changing in mean and variance. Data‐driven models based on statistics and ML can be applied to model uncertainty. Since no fundamental relationships are employed in these models, they are termed as black‐box models.
One of attributes to make ML and analytics applicable in process industries is that they need to be interpretable or understandable by operation personnel. Even if certain operations can be automated, human operators and decision makers must be in the loop and understand the prediction results for more confident implementation. If the people do not understand what the ML is doing, they will not take the risk to act upon it.
Personnel must be convinced that the new solutions offer more values than risks to be adopted. Comparing first principal models with ML models, industrial personnel tend to trust first principal models more than data‐driven models because they are more interpretable. Therefore, sophisticated ML methods including deep learning (DL) and deep reinforcement learning (RL) have to pass the interpretability test before they can be widely adopted in industrial practice.
In summary, process data analytics should have the following desirable features:
- Interpretable and scalable (up to thousands of variables);
- Making use of all kinds of data (g., process data, spectra, vibration, and image data);
- Relatively easy to apply to real processes comparing to other methods;
- Online use for real‐time monitoring and decision making;
- Offline troubleshooting as a valuable tool for continuous improvement.
What is the value proposition of SFP?
Finally, we must say that with the software designed by our company, you don’t need to worry about any aspect of your production process. The data that were introduced in the previous chapters, which were generated from various tools (sensors, transmitters, actuators, and valves), will never be lost, and be unified and be integrated in the SFP software cycle that our company has created. They will become useful information which is created by statistics, fundamentals, Artificial Intelligence, Industrial Internet of Things (IIoT), Cloud connectivity, Machine Learning and Mathematics Programming, that will be reported to managers in dashboards. With this information, you can also implement knowledge management, because you have turned data into information, and this information will become knowledge during the software.
You can easily calculate the productivity of human capital and machinery and predict production planning based on this information for future periods. Naturally, the number of financial damages caused by improper working of operators and machines will decrease and positive financial effects will be created in the factory.
The SFP software shows the entire production process graphically (FPC). When you have the entire process of the production line schematically, you will be able to easily identify production bottlenecks and design suitable solutions. Bottlenecks can have a significant impact on your production flow, greatly increasing production time and cost. For example, suppose a furniture manufacturer inputs metal and other raw materials into the production process and then incurs labor and machinery costs to produce and assemble the furniture. After the production is completed, the finished goods (FGs) are stored in the warehouse inventory.
When the furniture is sold to the customer, the cost of storage is transferred to cost of goods sold. If there is a bottleneck at the beginning of the production, the furniture manufacturer will not be able to enter enough raw materials into the production process, as a result, the machinery will remain unused and the paid workers will not perform productively, and the situation of non-optimal use of resources will be created. This increases the cost of production and also presents a large potential opportunity cost, and may mean that finished goods are not delivered to customers on time.
The bottleneck affects the production capacity that the company can achieve each month. Company managers may decide to reduce production targets to match the company’s production capacity, or they may seek solutions that simultaneously prevent bottlenecks and increase production. Companies often use Capacity Requirements Planning (CRP) tools and methods to determine and achieve production goals. But currently, with SFP that we prepared, you can use the solutions proposed by SFP in addition to identifying the bottlenecks.
In the material requirements planning (MRP) section, several different scenarios for ordering raw materials have been placed for companies to choose the best method according to their policies. Also, for the limitations that may occur in the production line, for example, the lack of raw materials in a product tree, SFP is able to design an alternative production plan in several seconds to prevent the idleness of the production line.
With the intelligentization that has been done in SFP you will be able to check the wastes rate of finished goods (FGs) and know the causes and roots of the occurrence of wastes and adopt the proposed solutions according to those reasons.
Identifying and rooting the reasons for not matching the actual production with the nominal capacity of the devices is one of the other capabilities of this software. For example, when the operators are having breakfast and they don’t start the machines on time, or the machines break down, or the production plan was not the right one. All these reasons can be clearly tracked in the software.
SFP has the ability to provide various reports of the product production process and the location of each part in the production process (Flow Process Diagram – FPC), supply chain with material requirements planning (MRP) and human capital productivity and efficiency of machinery (OEE).