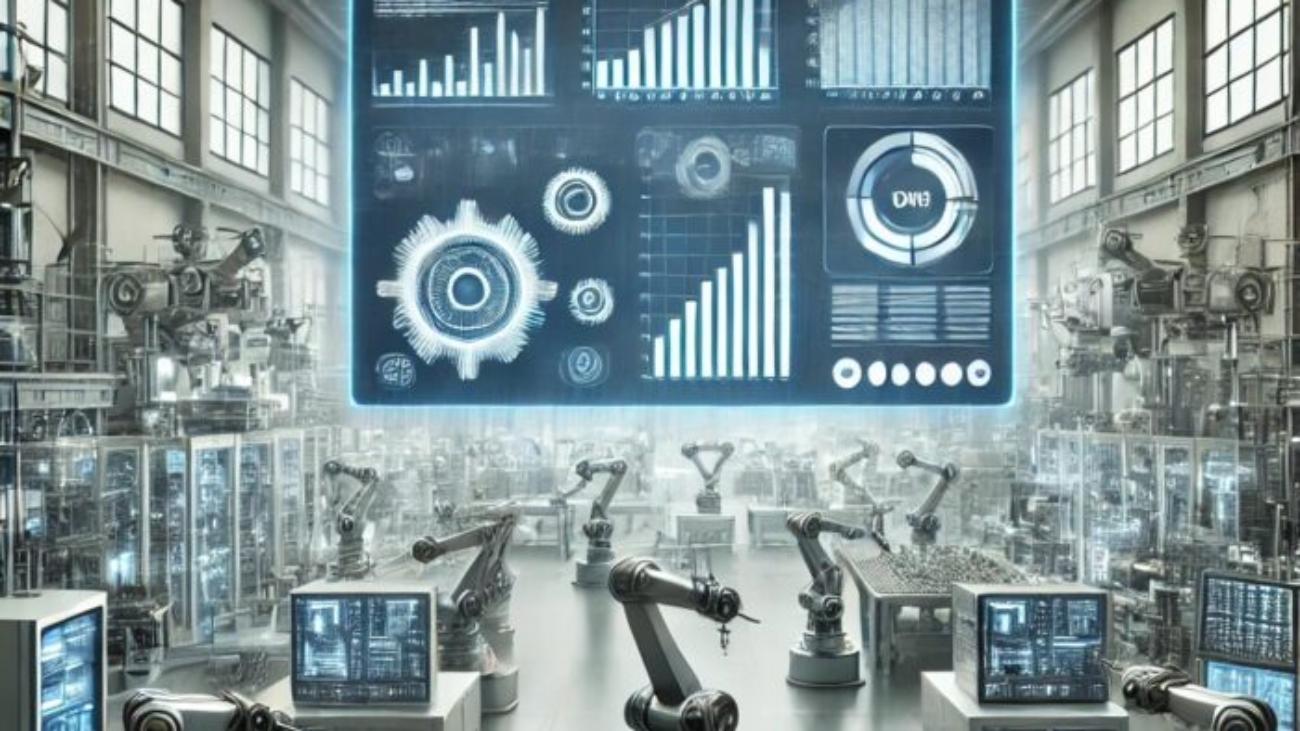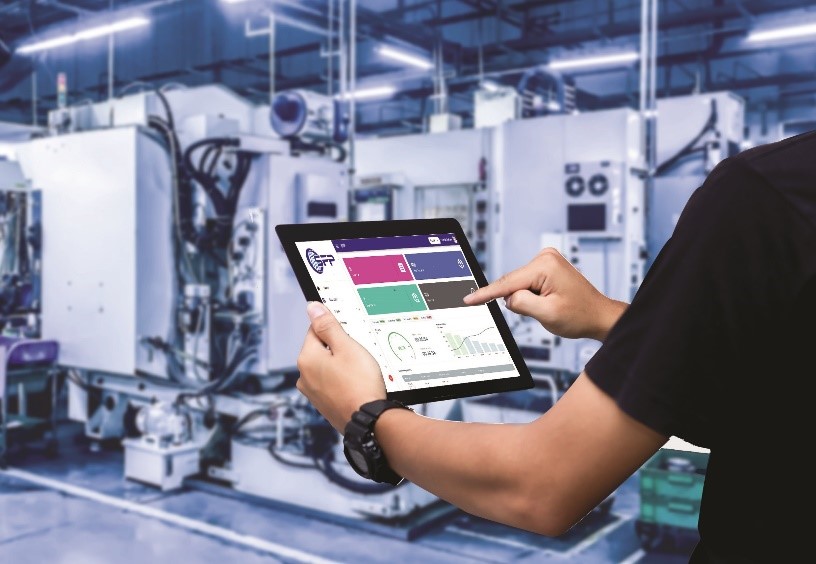
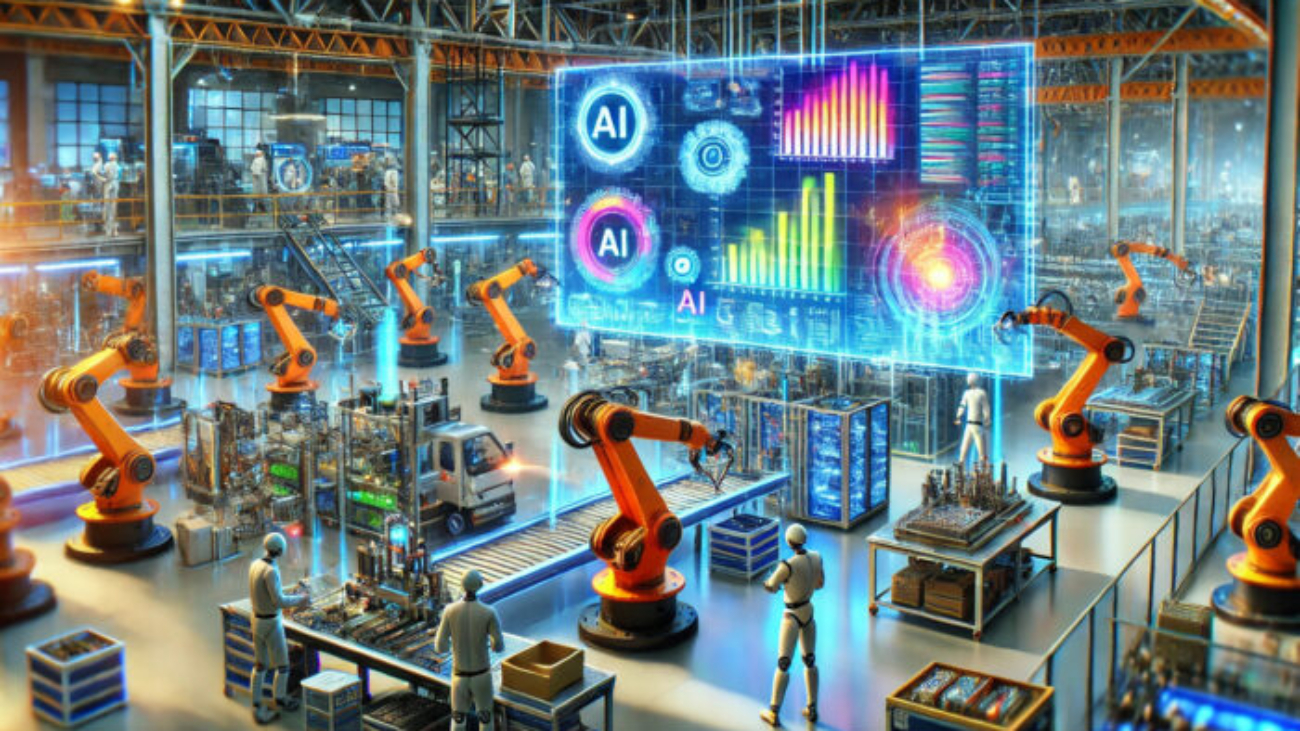
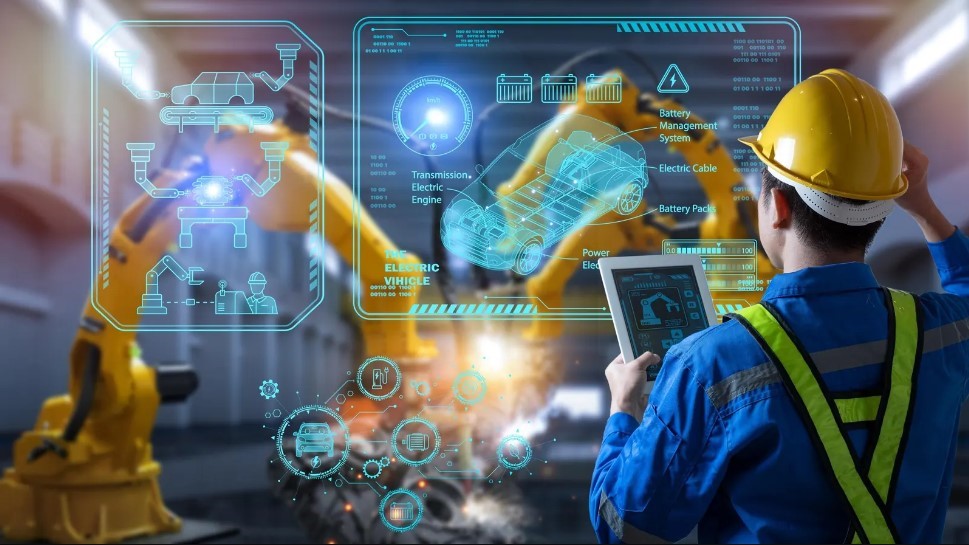
Artificial Intelligence (AI) has revolutionized various industries, and one of the sectors where its impact is particularly profound is manufacturing. The integration of AI technologies in manufacturing processes has brought about a multitude of benefits, leading to increased efficiency, productivity, and innovation.
AI in manufacturing
In this comprehensive guide, we will delve into the role of AI in Manufacturing, uncovering the key benefits and the most common applications that are revolutionizing the industry. You’ll learn about the essential steps to implement AI into your manufacturing processes, how to choose the right AI tools and technologies, and strategies to overcome the challenges associated with AI implementation. Additionally, through case studies, this guide will showcase real-world successes of AI in manufacturing, offering insights into future trends and emerging technologies that could shape the next generation of manufacturing.
Understanding the Role of AI in Manufacturing
AI in Manufacturing has profoundly transformed the manufacturing industry, introducing capabilities that mimic human intelligence, automate decision-making, and enhance operational efficiency. The integration of AI is not just transforming the way manufacturing processes are conducted; it’s also redefining the potential for productivity and precision in ways previously unimaginable. The significance of AI in manufacturing lies in its ability to analyze vast amounts of data, optimize operations, and predict potential failures before they occur, thus ensuring smoother, more efficient production lines and higher-quality products.
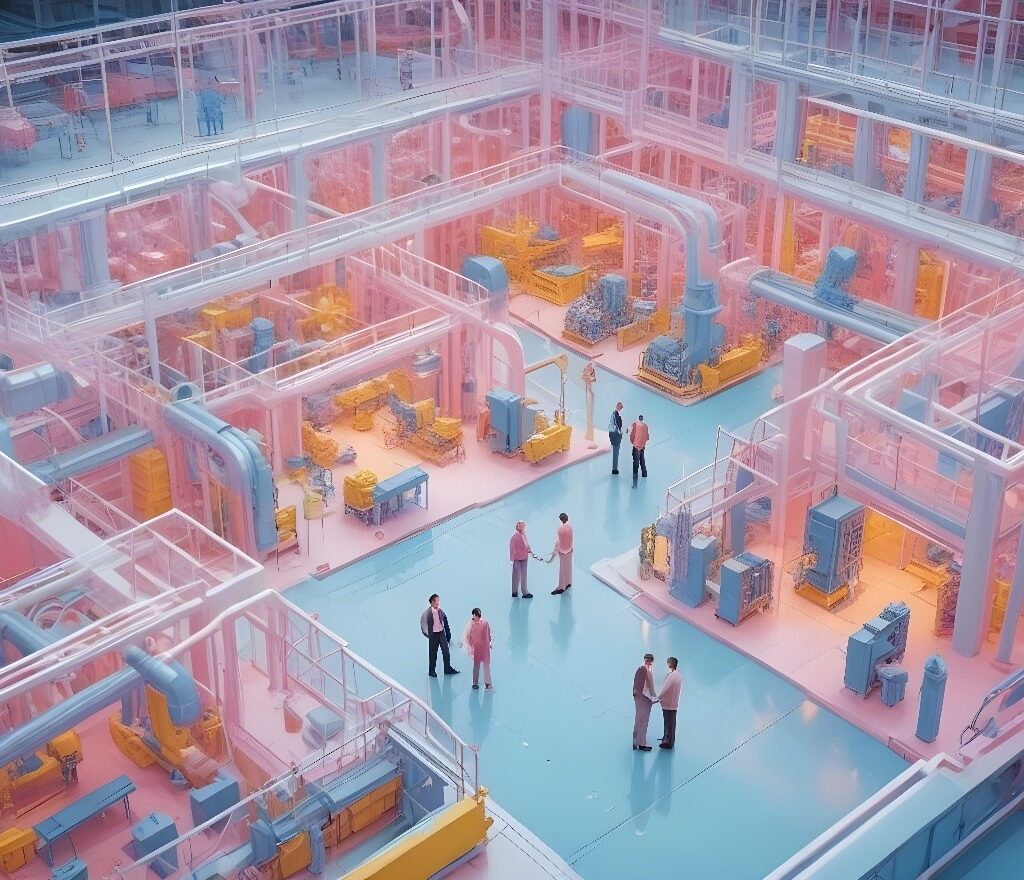
Implementing AI in Manufacturing
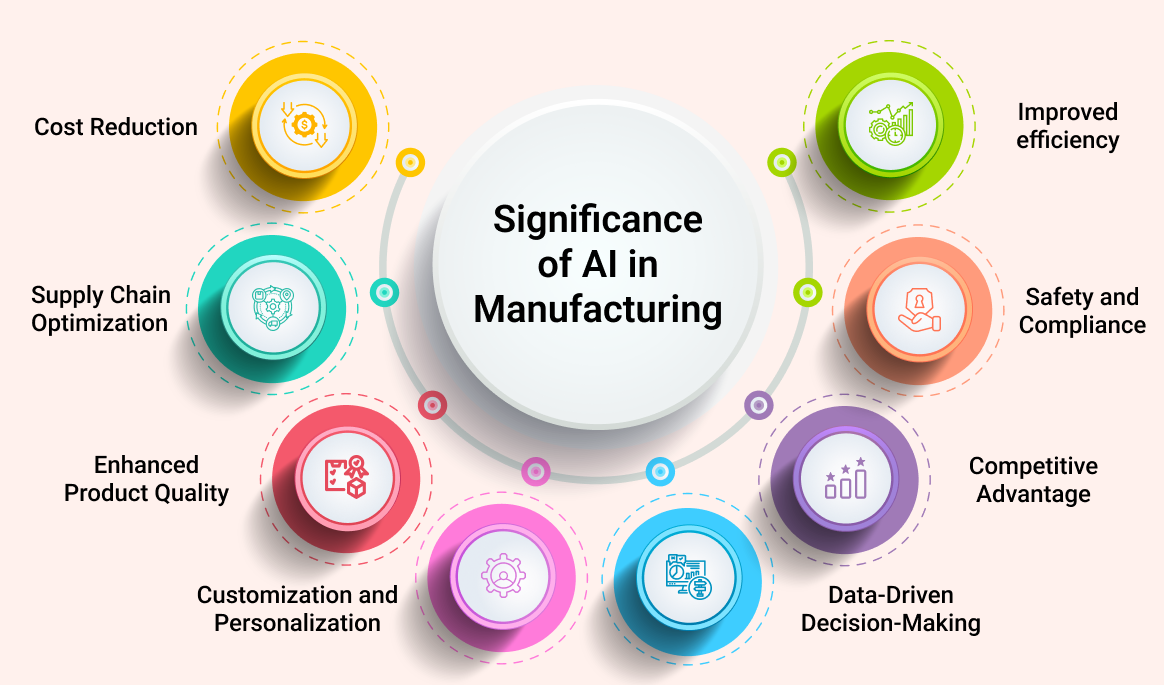
The integration of AI in Manufacturing processes has led to numerous positive effects on the industry including improved efficiency, enhanced quality control, predictive maintenance, supply chain optimization, customization, and safety improvements. By leveraging AI technology, manufacturers can achieve greater competitiveness, innovation, and success in the rapidly evolving manufacturing landscape.
- Improved Efficiency: AI in manufacturing can analyze large amounts of data quickly and accurately, leading to more efficient production processes. This can result in reduced downtime, increased productivity, and lower operational costs.
- Enhanced Quality Control: AI in manufacturing can be used to monitor and control production processes in real-time, ensuring that products meet quality standards. This can help manufacturers reduce defects and improve overall product quality.
- Predictive Maintenance: AI can analyze data from sensors and other sources to predict when equipment is likely to fail. This allows manufacturers to perform maintenance proactively, reducing downtime and extending the lifespan of machinery.
- Supply Chain Optimization: AI can optimize supply chain operations by analyzing data on inventory levels, demand forecasts, and production schedules. This can help manufacturers reduce lead times, lower costs, and improve overall supply chain efficiency.
- Customization and Personalization: AI in manufacturing can help manufacturers customize products to meet individual customer needs and preferences. Following such an approach can encourage a sense of loyalty in the customer and help increase customer satisfaction.
- Safety Improvements: AI can be used to monitor and analyze data from sensors to identify potential safety hazards in the manufacturing environment. This feature in artificial intelligence can play an effective role in preventing accidents and improving overall safety.
Steps to Implement AI in Manufacturing:
1) Assessing Current Systems for Implementing AI in Manufacturing
To successfully implement AI in Manufacturing processes, the first crucial step is to assess your current systems comprehensively. Understand that the effectiveness of AI adoption heavily relies on the digital growth of each organization. Companies that are further along in digitizing their core business processes are significantly more likely to succeed in integrating AI effectively. Evaluate your existing technology infrastructure to ensure it is capable of supporting AI applications. This includes having a robust data architecture that makes data accessible, reliable, and secure. Additionally, your applications should be scalable, integrated, and preferably cloud-based to facilitate the seamless adoption of AI technologies.
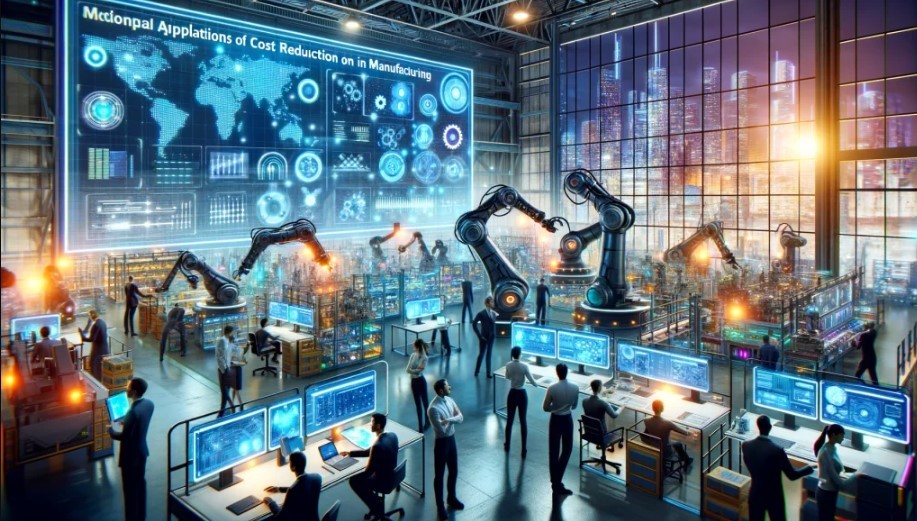
2) Identifying Applications of AI in Manufacturing
Once desired systems are assessed, the next step is identifying the most beneficial AI applications for specific manufacturing needs. Begin by clearly defining goals for AI in Manufacturing. It doesn’t matter if you’re aiming to automate repetitive tasks or transform the nature of work through collaboration between humans and machines. Each AI initiative should start with a solid business case that aligns with your strategic objectives. Consider various levels of automation and AI, from systems where humans remain in the loop to fully autonomous processes. This step-by-step approach not only builds trust in the technology but also enhances the acceptance and integration of AI across your organization.
For instance, predictive maintenance can be a starting point where AI uses machine learning algorithms to predict equipment failures before they happen, thus reducing downtime and maintenance costs. Furthermore, leverage AI to optimize the entire value chain, from production to customer service. Do not limit the use of AI to isolated projects or departments; instead, integrate it across business units to maximize its impact. This holistic approach ensures that AI contributes to continuous improvement and innovation within your company.
By following these steps and continuously experimenting and learning from outcomes, you can effectively implement AI in manufacturing processes, leading to enhanced efficiency, reduced costs, and improved product quality.
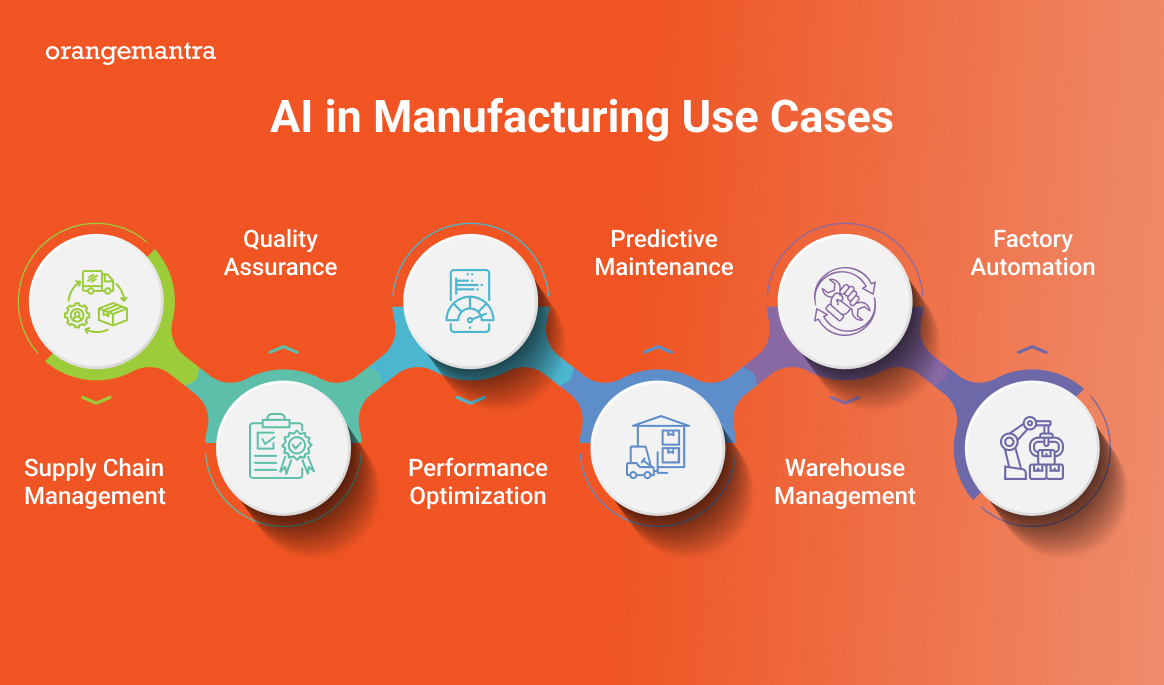
Common Applications of AI in Manufacturing:
A) Predictive Maintenance
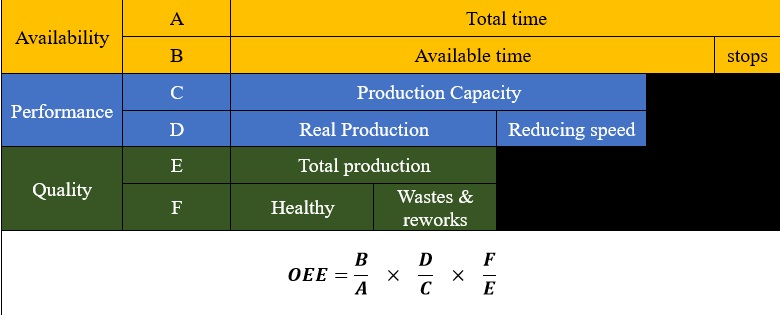
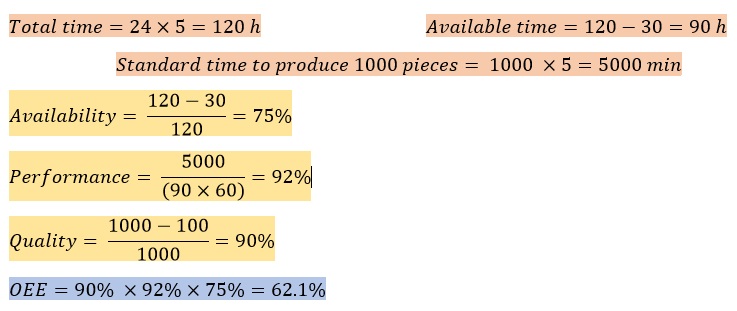
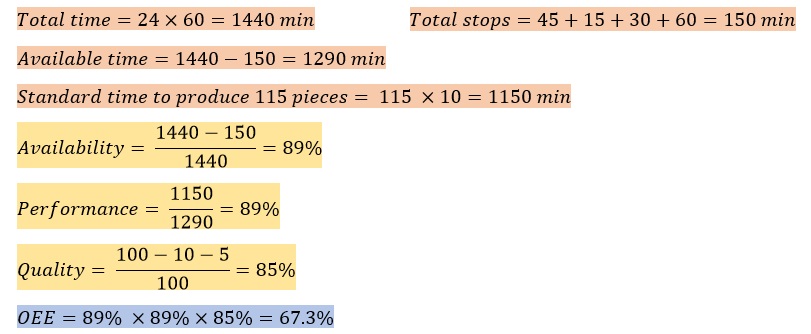
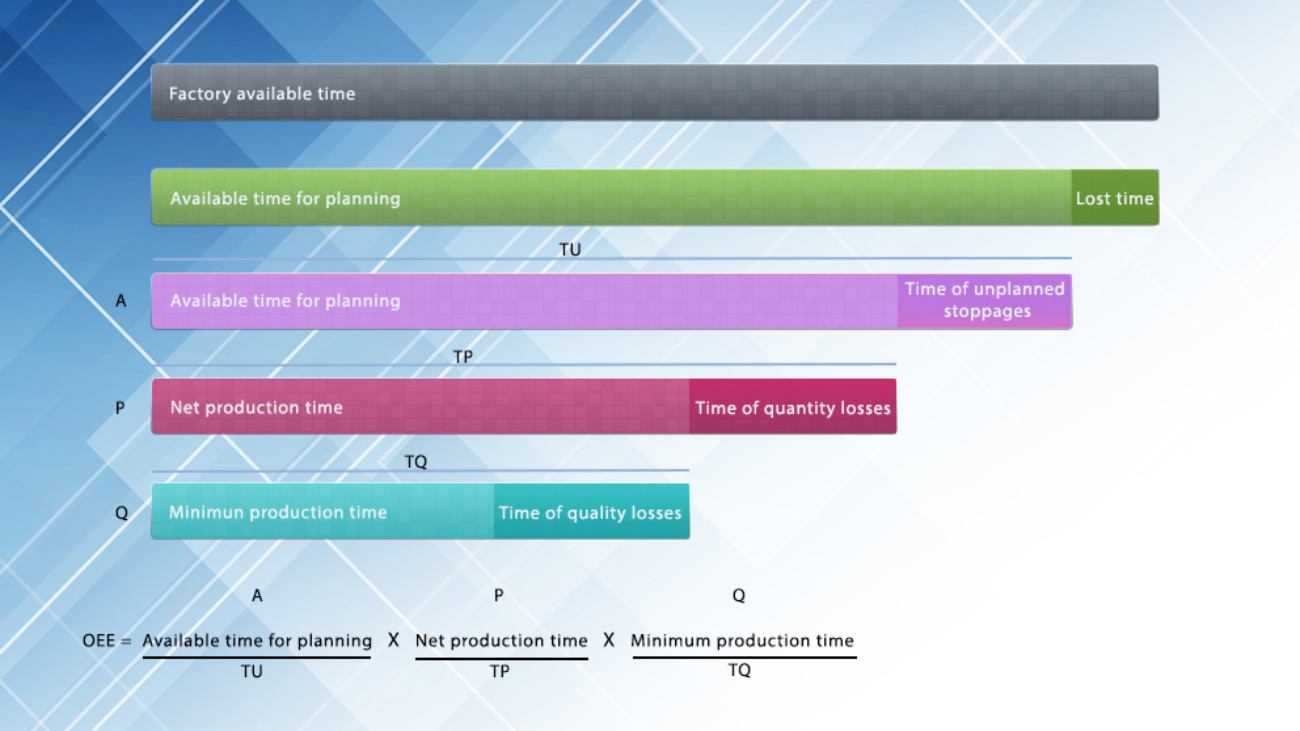
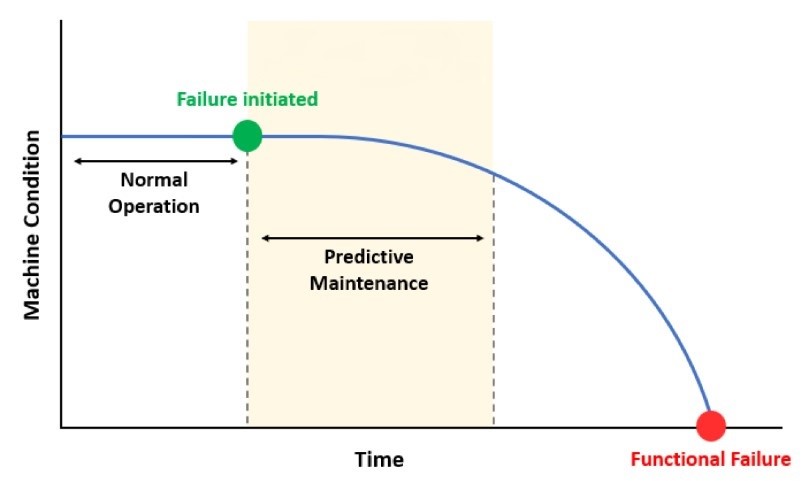
Predictive maintenance stands out as a transformative application of AI in Manufacturing. By leveraging machine learning algorithms, predictive maintenance systems analyze historical and real-time data to foresee potential equipment failures before they occur. This proactive approach not only reduces downtime but also extends the lifespan of machinery, thereby enhancing overall productivity and reducing operational costs. For example, AI frameworks connected through the Industrial Internet of Things (IIoT) enable “smart factories” to utilize vast datasets to anticipate and mitigate equipment failures, significantly improving overall equipment effectiveness (OEE).
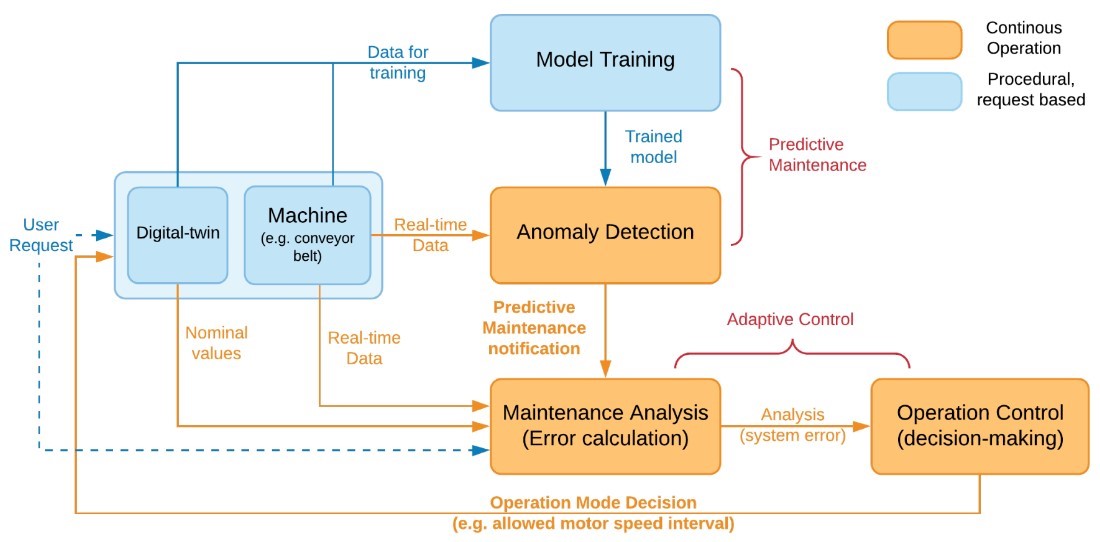
By integrating human insight into the learning process, AI-based systems continually refine their predictive capabilities, making them more adept at anticipating machinery failures. This application previously operated on rule-based systems, which had limitations in solving machine health issues comprehensively. Key elements in Predictive Maintenance include machine analysis, human inspection, and anomaly detection. The machine analysis process uses unsupervised learning to analyze sensor data and discern patterns indicating normal machinery operation. Human inspection investigates anomalies, labeling them with root causes, thereby enabling semi-supervised learning for future anomaly detection. This iterative process enhances prediction accuracy over time. Flags deviations from established patterns as anomalies, signaling potential issues.
Complex machinery operates under varying conditions and generates extensive data encompassing parameters like temperature, pressure, and vibrations. AI-based systems proactively identify potential issues rather than reacting to anomalies. Predictive Maintenance generally has progressed from rule-based to AI-based systems leveraging advanced analytics and machine learning.
In rule-based predictive maintenance, maintenance actions hinge on fixed thresholds coded into the system. Alerts are generated if measurements exceed these thresholds. For instance, a pump might trigger an alarm when its vibration signal RMS exceeds 7.1 mm/s. This approach relies heavily on established ISO standards and conventional methods. For example, consider a temperature sensor in critical equipment that alerts when temperatures surpass 60 – 70°C (according to the type of device and its settings), signaling potential equipment failure. While simple to implement, this method proves inadequate for larger, more intricate machinery.
Machine Mode Analysis in AI-Based Predictive Maintenance:
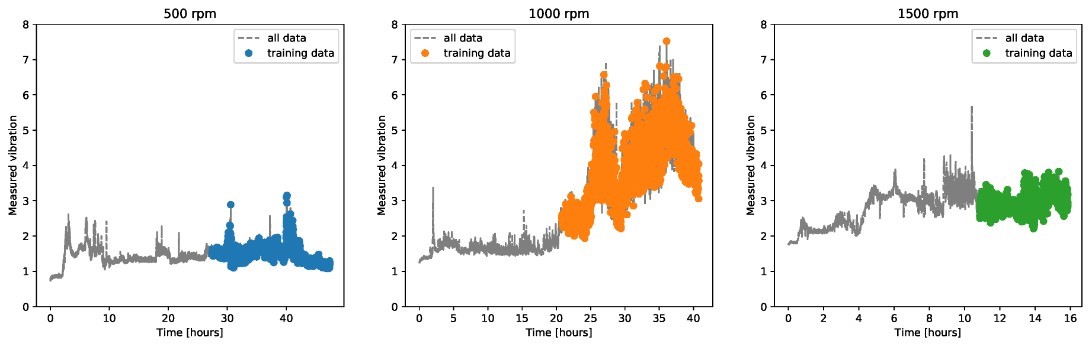
Many machines operate under varying cycles, power levels, and processing conditions influenced by factors like fluctuating production speeds and raw materials. In rule-based predictive maintenance systems, undesired anomaly alarms may trigger due to expected changes in these parameters, leading to numerous false positives. To address this issue, each process parameter such as speed, and power along with representative signal samples should be incorporated into the training of an effective AI-based predictive maintenance model. Subsequently, this model enables the identification of distinct machine operating modes and deviations from these modes.
Importance of Anomaly Detection in Rotating Machinery
Anomaly detection in rotating machinery leverages advanced data analytics to enhance predictive maintenance strategies. By detecting anomalies early and accurately, organizations can mitigate risks, optimize maintenance efforts, and extend the operational life of critical assets. The use of machine learning techniques continues to advance the field, enabling more precise and effective anomaly detection in industrial applications. Rotating machinery such as pumps, turbines, motors, and generators are critical assets in industrial settings. They operate under varying conditions and are subject to wear, fatigue, and other degradation mechanisms. Anomaly detection helps in:
- Early Fault Detection: Identifying anomalies early can prevent catastrophic failures and minimize downtime.
- Condition Monitoring: Continuous monitoring of machinery health provides insights into its operational status.
- Optimized Maintenance: Predictive maintenance schedules repairs or replacements based on actual machine condition, optimizing maintenance resources.
Techniques Used in Anomaly Detection:
- Statistical Methods: These include methods like mean and standard deviation analysis, Z-score analysis, and cumulative sum (CUSUM) algorithms. These methods detect anomalies based on statistical deviations from the expected behavior of the machinery parameters.
- Machine Learning Techniques: Supervised, unsupervised, and semi-supervised machine learning algorithms are used to detect anomalies:
- Supervised Learning: Requires labeled data where anomalies are explicitly identified. Algorithms like Support Vector Machines (SVM) or Random Forests can be trained to classify anomalies.
- Unsupervised Learning: Detects anomalies without labeled data by learning patterns in normal data. Techniques like clustering (e.g., K-means) or density-based methods (e.g., Local Outlier Factor) are commonly used.
- Semi-supervised Learning: Uses a combination of labeled and unlabeled data to improve anomaly detection accuracy over time.
Example of Anomaly Detection in Rotating Machinery
Let’s consider a centrifugal pump used in an industrial process:
- Data Collection: Sensors measure parameters such as vibration, temperature, pressure, and flow rate.
- Data Preprocessing: Raw sensor data undergoes preprocessing steps like normalization, filtering, and feature extraction to prepare it for anomaly detection.
- Anomaly Detection Algorithm: An unsupervised learning algorithm like Isolation Forest is applied to the preprocessed data. This algorithm identifies instances where the data points are significantly different from normal patterns.
- Result Interpretation: Detected anomalies are flagged and presented to maintenance personnel for further investigation. For example, a sudden increase in vibration amplitude beyond normal operational limits could indicate bearing wear or misalignment.
B) Quality Control by AI in Manufacturing
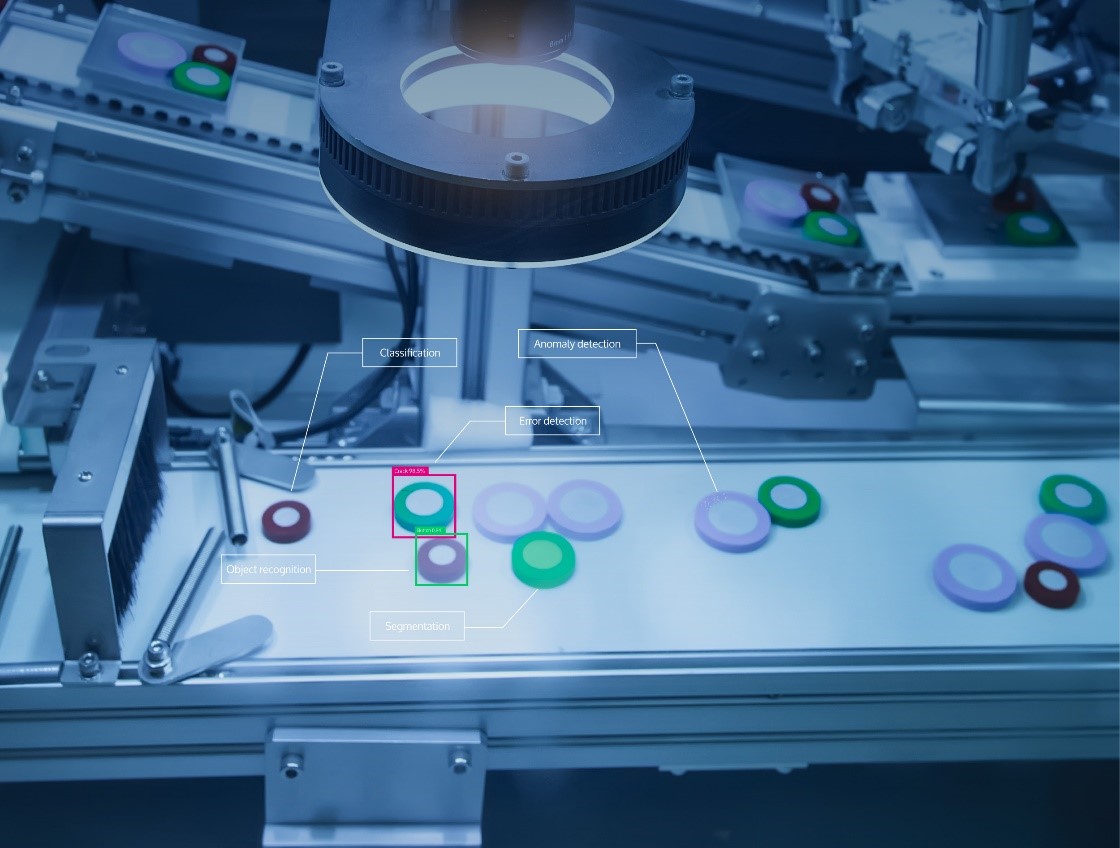
AI in Manufacturing significantly enhances quality control (QC) processes, ensuring products meet stringent standards while reducing waste and human error. AI-powered systems, particularly those utilizing machine vision, are pivotal in defect detection and product inspection. These systems analyze images captured during production to identify any defects such as misalignments or inconsistencies that might not be visible to the human eye. Moreover, AI-driven QC systems contribute to maintaining high standards by ensuring consistency across production batches, reducing the incidence of defective outputs, and thereby safeguarding brand reputation. They also play a crucial role in regulatory compliance by automatically detecting non-conformities and potential safety issues before products reach the market. AI applications in QC are not limited to defect detection; they also include automated measurement and real-time monitoring of production environments. This ensures that products are not only manufactured to precision but are also stored and transported under optimal conditions, thus maintaining their quality until they reach consumers.
In summary, the integration of AI in Manufacturing through predictive maintenance and quality control not only streamlines operations but also ensures high quality and compliance, positioning manufacturers at the forefront of industry innovation and efficiency.
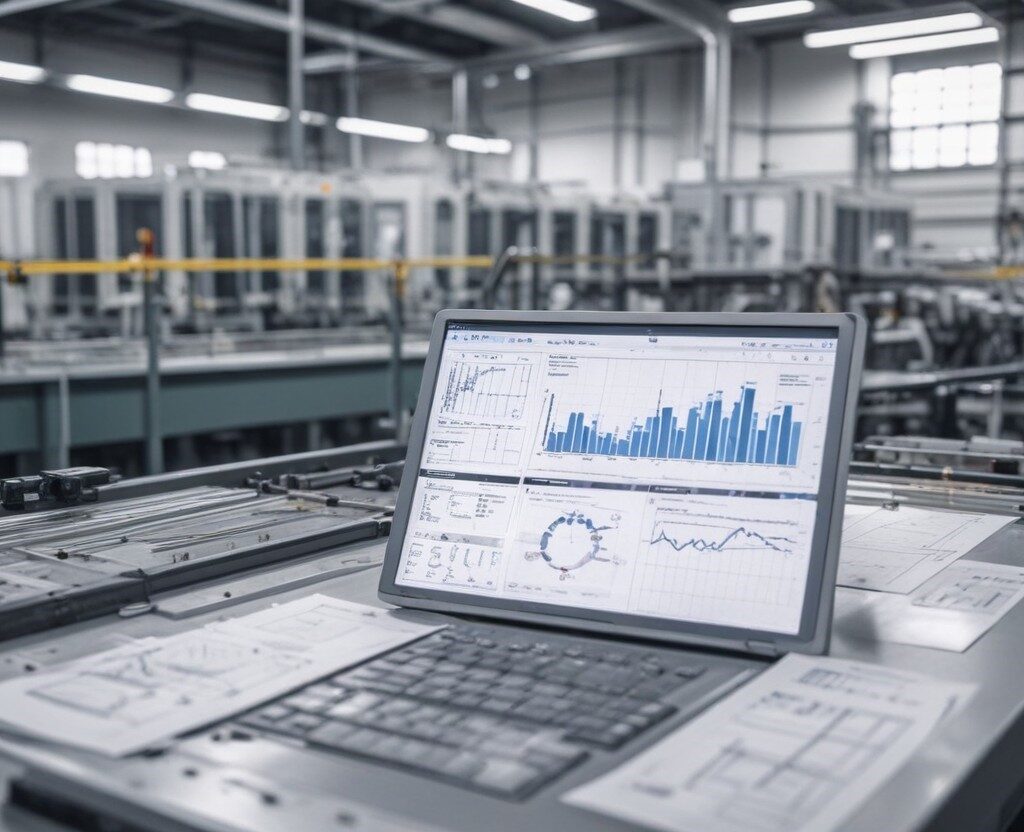
AI Inspection in Manufacturing
Inspection in AI in Manufacturing refers to the use of artificial intelligence (AI) technologies to automate and enhance the inspection processes in manufacturing industries. It involves the application of computer vision, machine learning, and other AI techniques to analyze and interpret visual data, such as images or videos, to detect defects, anomalies, or quality issues in manufactured products.
One example of inspection AI in Manufacturing is the inspection of electronic circuit boards. Traditional methods of inspection involve manual visual inspection, which can be time-consuming and prone to human error. With AI inspection, computer vision algorithms can be trained to analyze images of circuit boards and identify any defects or abnormalities, such as missing components, soldering issues, or incorrect placements. This helps in improving the accuracy and efficiency of the inspection process.
Another example is the inspection of automotive parts. AI inspection systems can be used to analyze images or 3D scans of car components, such as engine parts or body panels, to detect any manufacturing defects, surface imperfections, or dimensional variations. By automating this process, manufacturers can ensure the quality of their products and reduce the chances of faulty parts reaching the market.
In terms of a table, here’s a simplified example to illustrate the potential benefits of AI inspection in manufacturing:
| Traditional Inspection | Ai Inspection |
| Manual Visual Inspection | Automated Analysis of Visual Data |
| Prone to Human Error | Improved Accuracy And Consistency |
| Time-Consuming | Faster Inspection Process |
| Limited Scalability | Scalable To Handle Large Volumes of Data |
| Subjective Interpretation | Objective and Standardized Analysis |
| Higher Cost | Potential Cost Savings in The Long Run |
It’s important to note that the specific applications and benefits of Overall Equipment Effectiveness inspection can vary depending on the industry, product, and manufacturing process involved. Nonetheless, the overall goal is to leverage AI technologies to enhance the inspection process, improve product quality, and increase efficiency in manufacturing.
Key Benefits of Integrating AI in Manufacturing
Increased Efficiency and Productivity
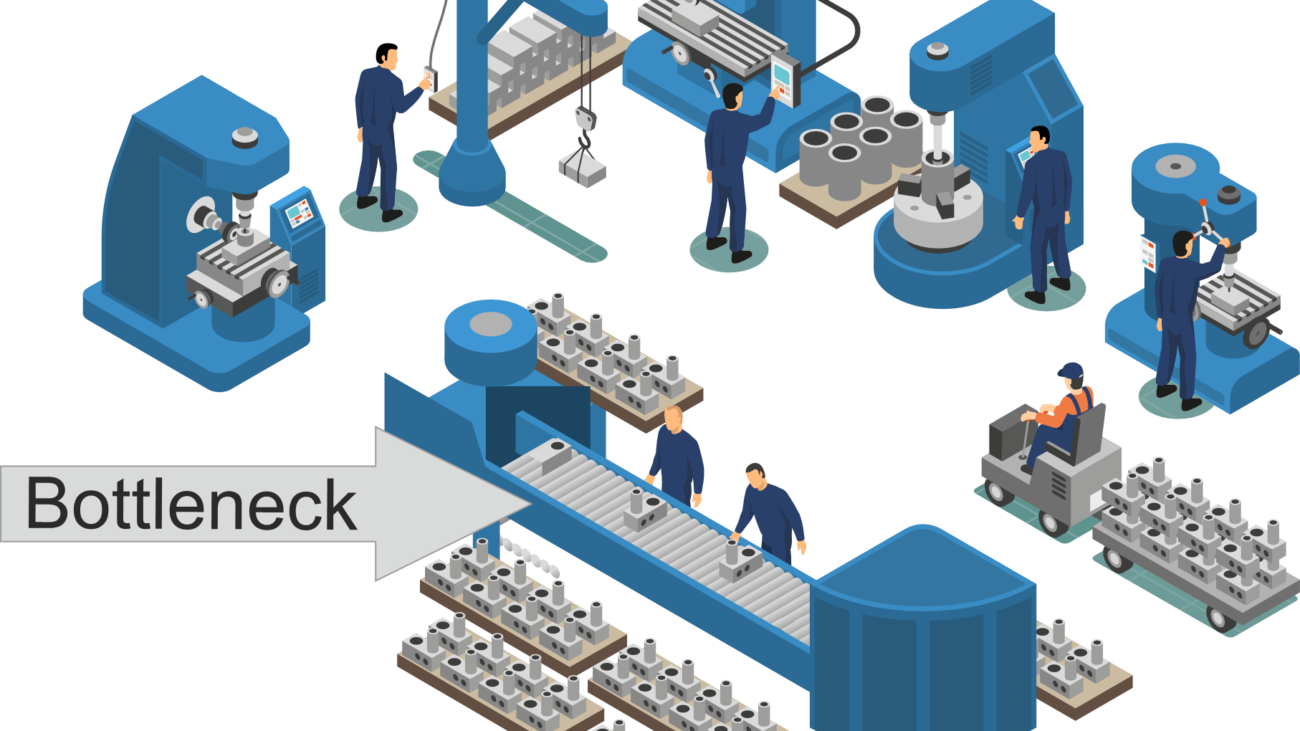
One of the most significant advantages of integrating AI in Manufacturing is the substantial increase in efficiency and productivity. By automating repetitive and time-consuming tasks such as data entry, invoicing, and scheduling, AI technology frees up employee time, allowing them to focus on more critical and strategic aspects of their work. Furthermore, AI-driven data analysis and annotation play a crucial role in enhancing productivity by enabling businesses to make informed decisions on resource allocation and investment. Predictive analytics, a powerful application of AI, allows companies to analyze large datasets to identify patterns and trends. This capability not only guides decision-making processes but also helps in identifying potential bottlenecks and inefficiencies within workflows. By leveraging AI tools, businesses can optimize processes and significantly improve productivity. Additionally, AI-enabled systems can forecast demand and supply dynamics, enabling strategic decisions regarding inventory management, staffing levels, and pricing strategies.
Cost Savings and Reduced Waste
AI technologies also contribute significantly to cost savings and waste reduction in manufacturing. Predictive maintenance, enabled by AI in Manufacturing, analyzes sensor data from machinery to predict potential breakdowns before they occur. This proactive approach prevents expensive downtime, extends equipment life, and enhances overall productivity. Moreover, AI-driven quality control automates inspection tasks, ensuring products meet stringent quality standards and reducing the likelihood of defective products reaching customers. AI algorithms optimize various manufacturing processes by analyzing data from production lines, supply chain systems, and inventory management. This optimization not only reduces waste but also improves operational efficiency by identifying inefficiencies and suggesting actionable improvements. In terms of supply chain management, AI helps maintain optimal inventory levels and improves relationships with suppliers, which in turn reduces costs and accelerates delivery times.
Furthermore, AI in Manufacturing’s role in energy management contributes to more sustainable manufacturing practices. By analyzing energy usage patterns and identifying waste, AI provides strategies for optimizing energy consumption, which not only reduces costs but also minimizes environmental impact. The integration of AI in manufacturing underscores the transformative impact of AI technologies in redefining manufacturing processes.
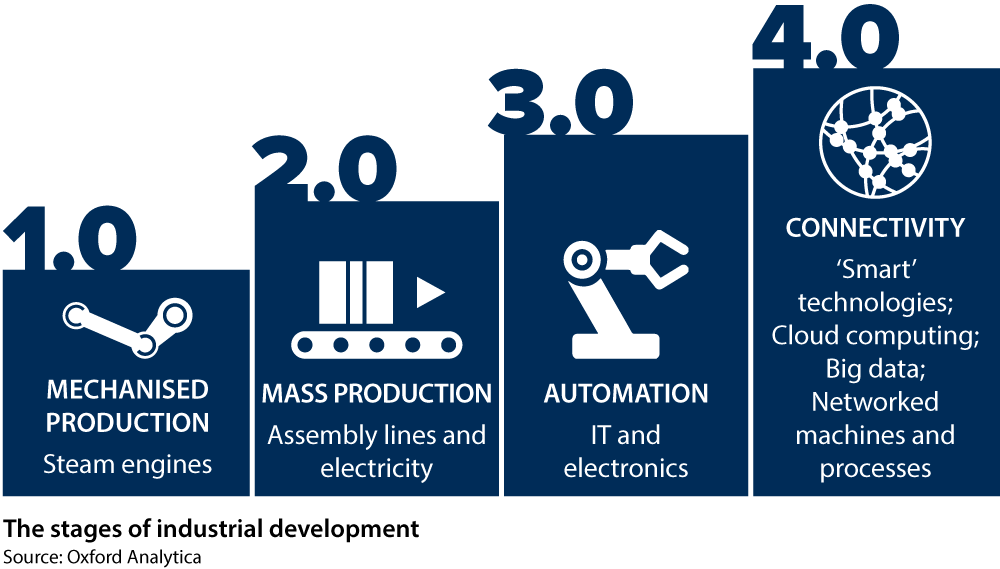
Historical Context and Evolution of AI in Manufacturing
The role of AI in Manufacturing is pivotal and ever-evolving. It not only enhances current processes but also paves the way for future innovations that continue to push the boundaries of what is possible in manufacturing. Maybe it can be said the journey of AI in manufacturing dates back over a century, with notable advancements during significant historical periods. For instance, during World War II, Ford implemented electro-mechanical vision systems to inspect aircraft parts, which dramatically reduced production cycle times by 60% at the Willow Run plant. This period marked the beginning of using AI to enhance manufacturing efficiency and output. The evolution continued through the 1950s and 60s with the introduction of robotics and more complex AI-driven processes. Technologies like Failure Modes and Effects Analysis (FMEA) and Statistical Process Control (SPC) became integral in monitoring and enhancing production health.
Today, the role of AI in Manufacturing has expanded into the realms of smart factories and Industry, where interconnected devices and systems communicate and operate semi-autonomously. These advancements not only streamline operations but also open new avenues for innovation and efficiency in manufacturing processes. As AI technology continues to advance, its applications in manufacturing are becoming increasingly sophisticated. Manufacturers are now employing AI to optimize supply chains, improve production schedules, and even manage energy consumption more efficiently, all of which contribute to reduced waste and improved delivery times.
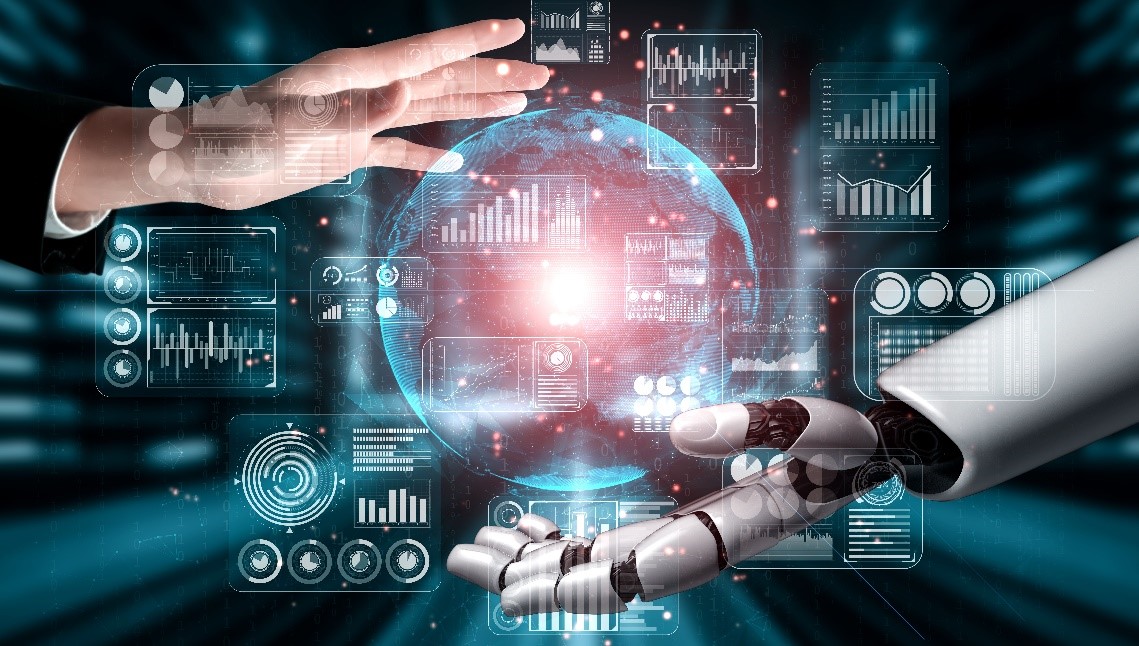
AI vs. Machine Learning in Manufacturing
AI and Machine Learning (ML) are often used interchangeably, but it is crucial to distinguish between the two. AI refers to the broader capability of machines to perform tasks that typically require human intelligence, including reasoning, learning, and self-correction. Machine Learning, a subset of AI, involves algorithms that enable machines to improve at tasks with experience, primarily through the analysis of large volumes of data.
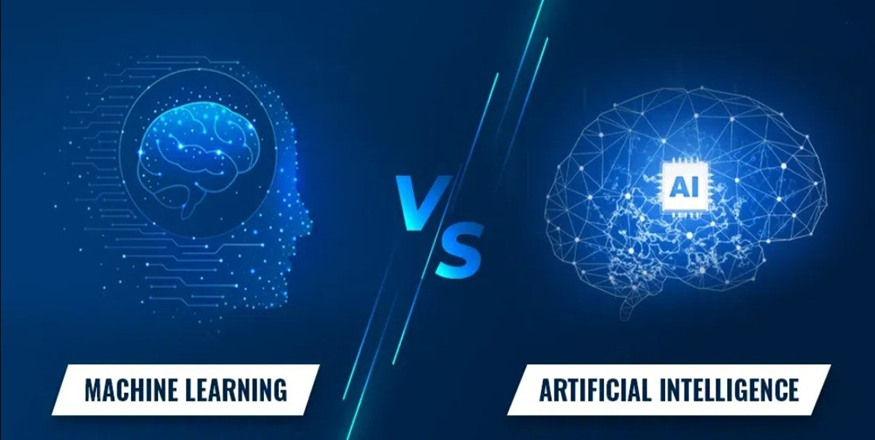
Machine Learning: Algorithms to incorporate intelligence into machines by automatically learning from data.
Artificial Intelligence: Ability of machine to imitate human intelligence
AI in Manufacturing encompasses a variety of applications, but Machine Learning specifically drives innovations in predictive maintenance and quality control. Predictive maintenance uses ML to foresee equipment failures before they occur, significantly reducing downtime and maintenance costs. Similarly, ML enhances quality control processes by enabling the precise detection of defects that might elude human inspectors, thus ensuring higher product quality and consistency.
Comparison Table between AI and ML:
| Aspect | AI | ML |
| Objectives | Human-Like Task
Agents |
Learn from Data
Patterns |
| Methods | Rule Base
Varied Al Learning |
Statistical Models
Algorithms |
| Implementations | Computer Vision
Robotics |
Pattern Recognition
Fraud Detection |
| Requirements | High Processing
Complex |
Heavy Reliance on Data |
| Evolution Metrics | Recall
Accuracy Precision |
Generalization
Avoiding Overfitting |
| Adaption To Complexity | Struggles With Complexity | Adapts through Data Patterns |
| Ethical Consideration | Accountability
Transparency |
Data Handling
Privacy Fairness |
| Human Integration | Intuitive Experiences
NLP |
Indirect Communication
Adaption |
Production Planning and Scheduling with AI in Manufacturing
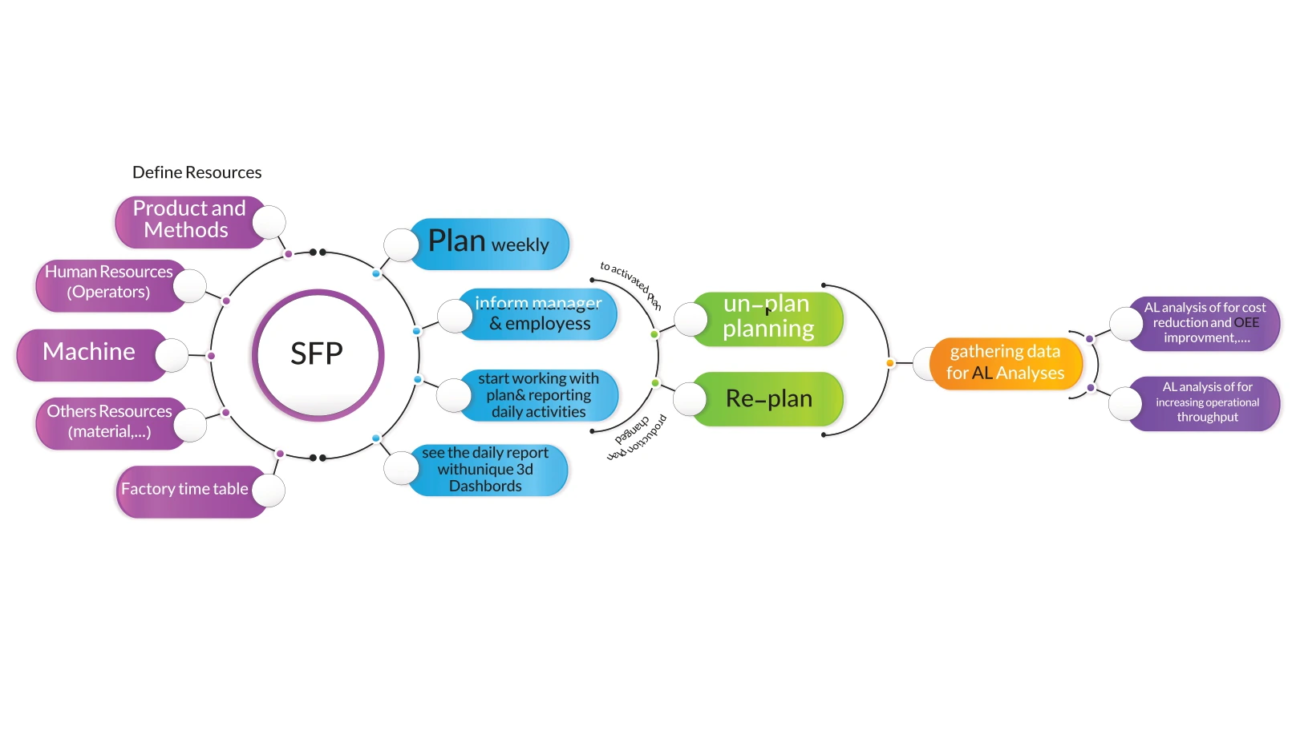
Production planning is a strategic process that includes planning and managing activities and managing resources related to the production of products or services in a company. The main purpose of production planning is to optimize production processes, manage resources, and improve production efficiency and quality. Artificial intelligence helps in production planning with the following:
- Artificial intelligence can be used in plan optimization of the production process, inventory management, setting machine parameters, resource allocation, time planning, and supply chain management with the help of commonly used algorithms such as machine learning algorithms and optimization algorithms.
- With the presence of artificial intelligence in the production industry, strategic and management decisions in this field will be more accurate and optimal; such as more accurate market forecasting and more comprehensive analysis of performance data.
- By using smart algorithms, energy consumption can be improved and the optimization of energy resources can be advanced to an acceptable level.
- Smart algorithms can determine the best solutions for production planning and inventory management by identifying market demand. Also, by using market data analysis, it is possible to identify current trends in the market, which can be used to design optimal strategies to compete with other companies and performed
- Artificial intelligence helps to increase productivity in production processes and reduce waste, such as optimizing the use of materials and resources, reducing setup time and changing devices, and improving operational processes.
Choosing the Right AI Tools and Technologies
AI Platforms and Solutions
When selecting tools and technologies for AI in Manufacturing, it’s essential to consider platforms that integrate seamlessly with your existing systems and can scale according to your needs. These platforms provide tools for data analytics, AI-based predictive maintenance, and process optimization, enabling you to leverage advanced analytics and machine learning to enhance operational efficiency. Some platforms offer comprehensive AI solutions tailored for the manufacturing sector such as:
AWS: This pre-trained platform provides a suite of AI services including SageMaker and Lex, which are designed to integrate with the broader AWS ecosystem, allowing for a flexible and scalable adoption of AI technologies. AWS provides manufacturers with cloud infrastructure and AI solutions that prioritize flexibility, scalability, and advanced analytics. AWS offers a suite of AI services, including Rekognition, Lex, SageMaker, Polly, and Comprehend that integrate seamlessly with existing infrastructure. This makes AWS a flexible solution for businesses of all sizes. One of the standout features of AWS is its strong predictive maintenance capabilities, which alert teams to potential issues before they become major problems. Overall, AWS offers manufacturers a comprehensive suite of tools to optimize their operations and drive productivity.
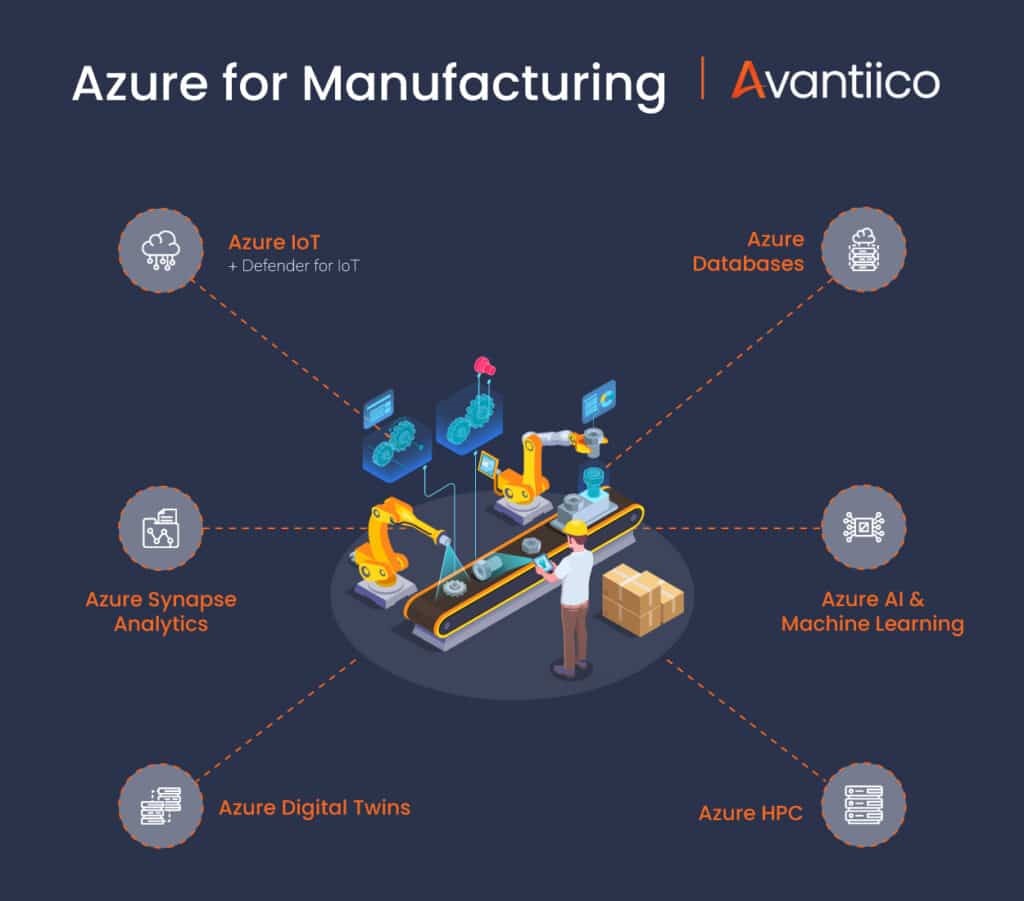
Azure: Similarly, Azure’s AI solutions automate the rollout of AI across various manufacturing processes. Azure AI seamlessly integrates with the full suite of Azure Cloud tools, streamlining the deployment of AI in manufacturing processes without requiring specialized ML engineering expertise. Manufacturers can leverage AI across their machinery for tasks such as inspection, inventory planning, and demand forecasting. The Azure AI Platform boasts a diverse array of services, including natural language processing, computer vision, conversational AI, and a fully managed machine learning service. These services empower developers to create sophisticated AI applications without deep knowledge of AI algorithms or infrastructure.
Google Cloud AI: This platform extends its capabilities to offer holistic data analysis and optimization of manufacturing processes.
IBM Watson and Oracle: These platforms focus on combining AI with IoT to deliver real-time insights and predictive analytics, enhancing decision-making and operational efficiency in manufacturing. These platforms support a wide range of applications from quality control to supply chain optimization, providing a robust foundation for integrating AI into your manufacturing operations.
GE Predix: General Electric (GE) offers AI solutions designed to improve manufacturing processes. The AI platform from GE predicts equipment maintenance needs, reducing downtime and enhancing operational efficiency. It also provides quality control by inspecting materials used in product construction. These tools seamlessly integrate with GE’s Industrial Internet of Things (IIoT) platform, enabling organizations to optimize performance, enhance efficiency, and lower costs. GE’s Digital Plant tools facilitate code-free development, empowering operators to make informed decisions quickly. GE enables businesses to maximize value through lean manufacturing, improved execution, and enhanced asset and process performance. For instance, a wind turbine using Predix can gather sensor analytics to identify anomalies and use predictive maintenance during planned downtime.
IoT & SAP Leonardo: This innovative platform AI in Manufacturing enables manufacturing businesses to integrate these technologies for a comprehensive operational overhaul. By harnessing the capabilities of AI and machine learning, SAP Leonardo automates various processes within the manufacturing environment. This empowers businesses to optimize their operations, foster collaboration, and enhance overall productivity.
Hardware Requirements
Choosing the right hardware is crucial for the effective implementation of AI in Manufacturing. By carefully selecting AI platforms and ensuring the hardware meets the specific requirements of your AI applications, you can optimize the integration of AI technologies in your manufacturing processes, it helps to reduce the relative cost, produce high-quality products, and improve efficiency. The hardware requirements vary significantly based on the AI applications you plan to run.
For high-performance needs, selecting CPUs with a balance between clock speed and core count is vital to handling complex computations efficiently. Additionally, the cache size and PCIe lanes in CPUs play a significant role in determining the computational efficiency and the ability to connect multiple peripherals and GPUs. Servers and storage also play a critical role, especially when dealing with large datasets. The choice of server can impact the speed and efficiency of AI model training, with newer models offering better performance and more extensive data handling capabilities. Additionally, considering the network speed is crucial as it can be a bottleneck in AI training, affecting the overall training time and efficiency.
AI-Based Product Development
AI-based product development refers to the use of AI technologies and techniques in the process of creating new products or improving existing ones. This approach leverages AI’s capabilities to analyze data, automate tasks, and make predictions to enhance various aspects of the product development lifecycle.
Here are some key components and benefits of AI-based product development:
- Market Research and Insights: AI can analyze large volumes of data from various sources such as social media, customer feedback, and market trends to provide valuable insights into customer preferences, market demands, and competitive landscapes. This helps in identifying potential product opportunities and understanding customer needs more effectively.
- Design and Prototyping: AI in manufacturing can assist in the design phase by generating innovative concepts, optimizing designs based on performance criteria, and even creating virtual prototypes. This can significantly speed up the product development process and improve the quality of designs.
- Predictive Analytics for Demand Forecasting: AI algorithms can analyze historical sales data, market trends, and other relevant factors to predict future demand for a product. This helps in optimizing production schedules, inventory management, and resource allocation.
- Quality Control and Testing: AI in manufacturing can be used to automate quality control processes by analyzing production data in real time, detecting defects, and ensuring that products meet quality standards. This can result in improved product quality and reduced defects.
- Enhanced Customer Service: AI-powered chatbots and virtual assistants can be integrated into products to provide proactive customer support, troubleshoot issues, and gather feedback for continuous improvement.
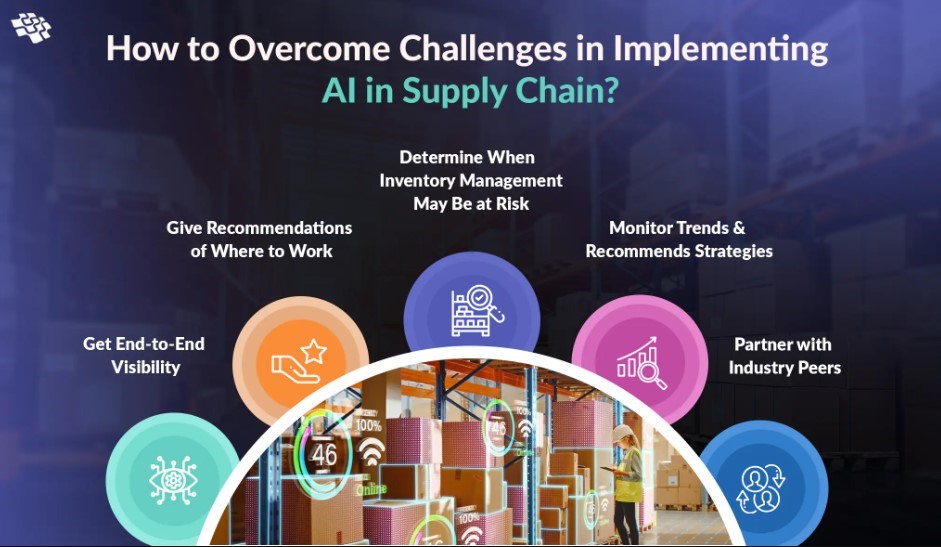
Overcoming Challenges in Implementing AI in Manufacturing
Data Quality and Availability
One of the primary challenges in Implementing AI in Manufacturing is ensuring the quality and availability of data. As manufacturers collect data from a broad network of sources, including physical sensors and manual reports, maintaining high data quality is crucial for effective AI applications. However, legacy system architectures and weak data governance can lead to poor data quality, with data at different plants being manipulated in various ways, making them ungovernable. To address these issues, it’s essential to modernize industrial data management and incorporate data quality as a central component of your data infrastructure. Adopting proper frameworks can improve data quality in targeted, iterative ways, focusing on the most critical business issues.
Workforce Training and Adaptation
Another significant challenge is preparing your workforce to adapt to and utilize AI technologies effectively. AI readiness to enhance AI-related competencies involves:
- Assessing the Current Capabilities
- Technological Proficiency of Employees
- Designing Tailored Training Programs
These programs should include a range of learning modalities such as in-person workshops, online courses, and hands-on exercises. Additionally, fostering a culture of continuous learning and collaboration is crucial. Establishing cross-functional AI teams and implementing mentorship programs can facilitate knowledge sharing and skill development, empowering employees to leverage AI tools confidently. To support these initiatives, organizations must invest in the necessary tools and infrastructure and integrate principle training to ensure employees understand the main implications of AI technologies. Moreover, emphasizing the collaborative nature of human-AI interaction helps employees see AI as a tool to augment their capabilities rather than a replacement, fostering a more accepting and innovative working environment. By addressing these challenges through strategic planning and continuous improvement, manufacturers can effectively overcome the hurdles of AI implementation, leading to enhanced productivity and innovation in their operations.
Case Studies of Successful Implementing AI in Manufacturing
Examples from Industry Leaders
In the realm of small and medium-sized manufacturers (SMMs), AI implementation has proven to be a game-changer. Some companies like Precision Global and Metromont have leveraged AI to enhance equipment uptime, increase quality and throughput, and reduce scrap, resulting in healthier bottom lines and increased profits. For instance, Rolls-Royce and JTEKT have implemented AI solutions that significantly improved their manufacturing processes. Delta Bravo, a third-party AI solutions provider, has been instrumental in these transformations, working on approximately 90 projects since 2017 and demonstrating substantial returns on investment. Another notable example is Vistra, a major U.S. power producer, which utilized an AI-powered tool to optimize heat rates. This implementation led to a 1% increase in efficiency, translating into millions in savings and reduced greenhouse gas emissions. Similarly, Wayfair optimized container ship logistics during the COVID-19 pandemic through AI, achieving a remarkable 7.5% reduction in inbound logistics costs.
Here’s an overview of how some of the top companies are using AI in Manufacturing:
- Augury:
Augury is a predictive maintenance company that utilizes AI and machine learning to monitor the performance of industrial equipment. By analyzing data from sensors and IoT devices, Augury’s AI algorithms can predict potential equipment failures, enabling manufacturers to perform proactive maintenance and avoid costly downtime. For example, Augury’s AI technology can analyze vibration patterns in machinery to detect early signs of wear and tear.
- Siemens:
Siemens, a global leader in industrial automation and digitalization, leverages AI in Manufacturing through its MindSphere platform. MindSphere uses AI and analytics to optimize production processes, improve product quality, and enable predictive maintenance. Siemens also offers AI-powered solutions for digital twins, which are virtual replicas of physical assets used for simulation and optimization.
- IBM:
IBM provides AI solutions for manufacturing through its Watson IoT platform. This platform integrates AI, analytics, and IoT to help manufacturers gain insights from their operational data. IBM’s AI capabilities enable manufacturers to enhance production efficiency, quality control, and supply chain management. For example, IBM’s AI algorithms can analyze sensor data from production lines to identify patterns and anomalies that may affect product quality.
- Intel Corporation:
Intel Corporation offers AI-powered solutions for manufacturing, including computer vision systems for quality inspection, predictive maintenance algorithms, and AI-based process optimization tools. Intel’s AI technology can be used to analyze visual data from cameras on the production line to detect defects or deviations from quality standards.
- Rockwell Automation:
Rockwell Automation uses AI and machine learning in its manufacturing solutions to enable predictive maintenance, optimize production processes, and improve overall equipment effectiveness. By integrating AI into its control systems and analytics platforms, Rockwell Automation helps manufacturers reduce downtime, minimize waste, and enhance productivity.
- GE:
GE employs AI in Manufacturing through its Predix platform, which provides industrial IoT and analytics capabilities. GE’s AI-powered solutions enable manufacturers to monitor equipment performance, predict maintenance needs, and optimize energy usage. For instance, GE’s AI algorithms can analyze data from sensors in power plants to optimize energy generation and reduce operational costs.
- NVIDIA:
NVIDIA offers AI technologies for manufacturing, including deep learning-based solutions for robotics, computer vision, and autonomous systems. NVIDIA’s AI platforms enable manufacturers to develop advanced robotics for tasks such as material handling, assembly, and inspection. For example, NVIDIA’s AI-powered robots can adapt to changing production environments and perform complex tasks with high precision.
- Uptake:
Uptake provides AI in Manufacturing and predictive analytics solutions for industrial equipment monitoring and maintenance. Uptake’s AI algorithms analyze sensor data from machinery to identify potential failures and maintenance needs. By leveraging AI-driven insights, manufacturers can optimize their maintenance schedules and reduce unplanned downtime.
- Veo Robotics:
Veo Robotics develops AI-powered software and hardware solutions for collaborative robotics in manufacturing environments. Veo’s AI technology enables robots to work safely alongside human workers, performing tasks that require precision and flexibility. For example, Veo’s AI-powered robots can assist with intricate assembly processes or material handling tasks.
- Automation Anywhere:
Automation Anywhere offers AI-powered robotic process automation (RPA) solutions for streamlining manufacturing operations. By integrating AI into RPA workflows, Automation Anywhere enables manufacturers to automate repetitive tasks, data entry processes, and workflow optimizations. For instance, Automation Anywhere’s AI-driven RPA bots can analyze data from production systems to make real-time decisions and trigger automated actions.
- Machina Labs, Inc.:
Machina Labs develops AI-driven solutions for industrial automation and predictive maintenance. Machina Labs’ AI technology uses sensor data and machine learning algorithms to predict equipment failures, optimize production processes, and improve operational efficiency. For example, Machina Labs’ AI platform can analyze historical data to forecast potential issues in manufacturing equipment and recommend proactive maintenance actions.
These companies are at the forefront of leveraging AI technologies to drive innovation and efficiency in the manufacturing industry, demonstrating the diverse applications of AI in areas such as predictive maintenance, quality control, process optimization, robotics, and industrial automation.
Lessons Learned
Implementing AI in Manufacturing is not without its challenges and learning curves. One of the critical lessons learned is the importance of starting with a clear problem definition and ensuring the right team composition, including leadership and technical experts, to foster successful adoption. For example, piloting AI on one production line before scaling it incrementally has proven to be a cost-effective strategy for smaller manufacturers. Moreover, understanding the economics of AI deployment is crucial. The hidden costs associated with computing resources in cloud environments can impact the overall cost-effectiveness of AI solutions. Manufacturers should be wary of technical lock-in with single cloud providers and consider the most cost-effective scaling options.
The industry has also learned that there is no one-size-fits-all solution in AI. Customizing AI applications to fit specific manufacturing processes and continuously tweaking them based on shifting priorities are essential for achieving desired outcomes. Additionally, the integration of MLOps (Machine Learning Operations) is crucial for translating AI projects into successful business cases, optimizing resource use, and ensuring scalability without prohibitive costs. These case studies and lessons underscore the transformative potential of AI in manufacturing, highlighting both the successes and the complexities involved in integrating advanced technologies into traditional manufacturing environments.
Future Trends and Emerging Technologies by AI in Manufacturing
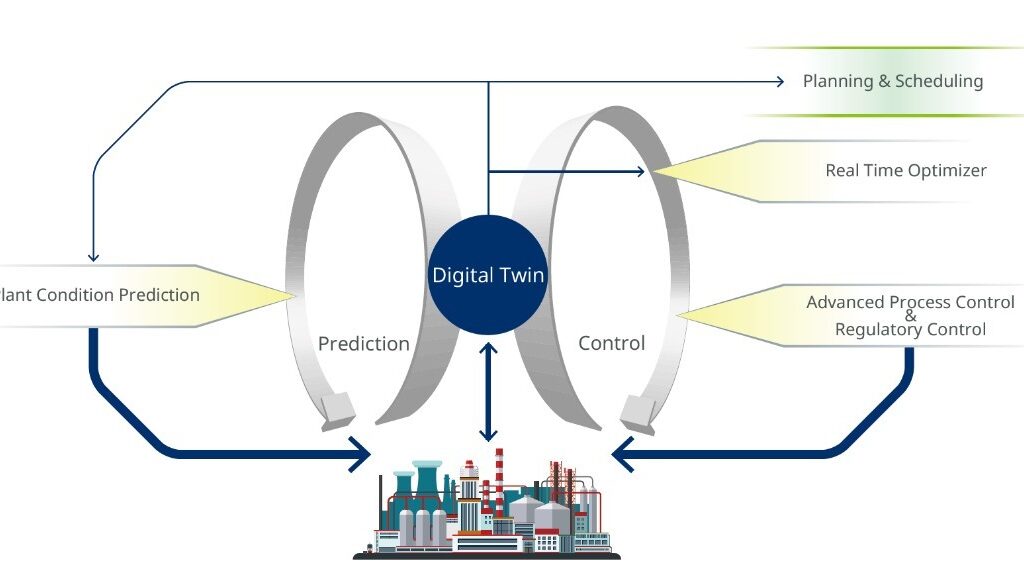
Digital Twins
The adoption of factory digital twins is rapidly increasing across various industries due to their significant benefits in optimizing manufacturing processes. They are expected to incorporate generative AI technologies, potentially revolutionizing factory management by providing real-time recommendations and adjusting to supply chain disruptions or changes in market demands. Moreover, advanced models can integrate seamlessly with existing manufacturing execution systems, IoT devices, and inventory databases. This integration enables optimal sequencing of product lines, minimizing downtime and enhancing efficiency within the confines of customer delivery requirements and physical storage capacities.
Collaborative Robots and Automation
Collaborative robots, or cobots, are transforming the industrial landscape by working safely alongside human operators without the need for physical barriers. This integration enhances safety, as cobots are equipped with advanced sensors to detect and avoid collisions, and can halt operations immediately if necessary. The annual growth rate indicates cobots’ ability to increase operational efficiency, improve quality control, and reduce production costs. Cobots are now increasingly equipped with AI, which simplifies their integration and operation. AI enables these robots to learn from human actions, predict maintenance needs, and even respond to voice commands, making them more intuitive and effective as team members on the production floor. Furthermore, the use of virtual reality (VR) in training allows workers to safely and effectively learn to operate and interact with cobots, further reducing the time and cost associated with their deployment.
The ongoing advancements in collaborative robots and digital twins signify a shift towards more interconnected and intelligent manufacturing environments. These technologies not only enhance current manufacturing capabilities but also pave the way for future innovations that could redefine industry standards and operational efficiencies.
Conclusion
The exploration of AI’s integration within manufacturing has laid bare the technology’s transformative power, from augmenting efficiency and precision to fostering substantial cost savings and sustainability. By harnessing AI, companies unlock a myriad of potentials, including predictive maintenance, optimized production schedules, and enhanced quality control, showcasing a significant leap toward achieving operational excellence. Importantly, the seamless fusion of AI with manufacturing processes emerges not just as an ambitious vision but as a practical step toward future-proofing industries against evolving challenges.
As the manufacturing landscape continues to evolve, the integration of digital twins and collaborative robots signifies the next frontier in industrial innovation. These advancements not only promise to elevate the efficiency and adaptability of manufacturing processes but also to redefine the relationship between human workers and machines, fostering safer, more collaborative environments. The journey ahead for AI in manufacturing is paved with opportunities for growth and innovation, urging continuous exploration, learning, and adaptation. Embracing these technological advancements equips manufacturers to navigate the complexities of modern industry dynamics, ultimately steering toward a future where efficiency, sustainability, and human ingenuity converge.