
Efficiency, Effectiveness and Productivity
The first step to get familiar with the Overall Equipment Effectiveness (OEE) index is to know its constituent words. In this section, we will get to know the meaning of effectiveness and the difference between it and efficiency and productivity.
At the first glance, the above words may seem the same, but in management science, there is a fundamental difference between the above words, which we will explain below.
1- Efficiency
Efficiency is determined by the amount of time, cost and energy, or in other words, by the resources needed to achieve certain results. Therefore, to calculate this index, we can calculate the ratio of planned resources to the actual number of consumed resources. For example, in a production system according to previous planning, we use a specific device that requires a predetermined amount of labor, energy and raw materials. If we are able to perform our daily production with less energy or fewer operators or less costs, we have done more efficiently with fewer resources.
2- Effectiveness
Effectiveness shows the degree of access to predetermined goals. For example, production effectiveness is determined by comparing production capacity with what is actually produced. In other words, the Effectiveness of a device can be calculated by dividing the actual production amount by the target or planned amount.
Therefore, Effectiveness does not provide us with information about the efficiency and number of resources that should be available for the production of the desired product.
3- Productivity
By considering the amount of production achieved (Effectiveness) compared to the efforts made to obtain the desired result (Efficiency) is determined. In other words, if we can produce more products with fewer resources, productivity will increase.
The purposeful definition of productivity is as follows: “Expanding a company to produce more wealth! The goal of a manufacturing company is not only to reduce its consumption costs, but also to produce wealth as much as possible. Usually, to calculate the productivity, we divide the output by the amount of input, which in a production system is equal to: output with the manufactured product and input is the same as the resources consumed for production.
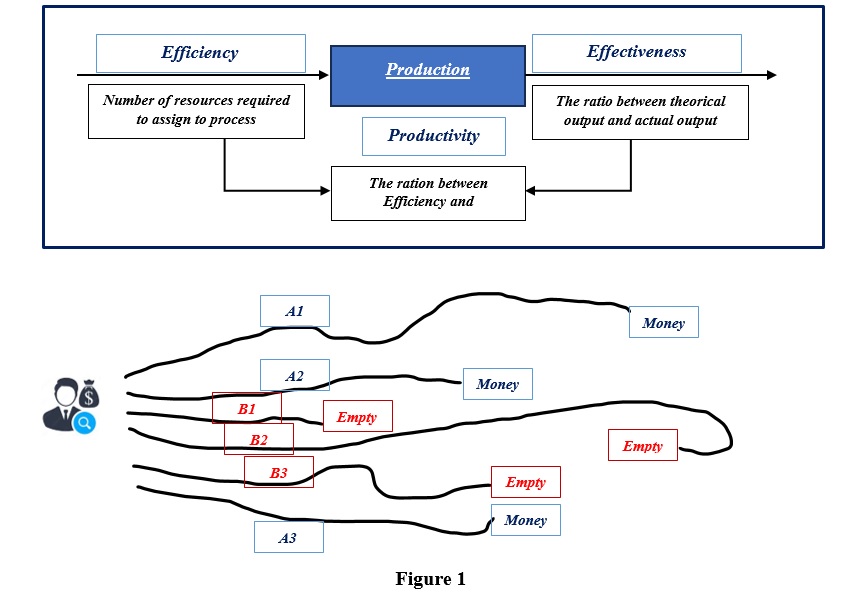
According to Figure 1, if we consider the goal of reaching the money, the method of reaching it is not important, that is, if we reach the money through any of the ways A1, A2, A3, we have acted effectively (Effectiveness), but in terms of the efficiency of reaching the destination with the least resources, regardless It is desired from its correctness, for example, the selected goal may be incorrect, in the above figure, ways B1, B2, B3 are wrong ways while in efficiency, we choose the closest path which is B1 but it leads to a wrong way while it is the most efficient way among all the ways.
In productivity, in addition to choosing the right destination, the closest way is also chosen to reach the desired destination. In other words, path A2 not only brings us to the goal, which is also the closest way to the money. So, with selecting this way, we have reached the target, and this way is more effective because of the shortest route (cost).
Productivity also emphasizes on Effectiveness and efficiency at the same time with minimum cost. Also with productivity, we reaches our target. According to the above definitions, the Overall Equipment Effectiveness (OEE) seeks a goal, and reaching it means being effective, but what is this goal?
The goal is to use the maximum capacity of the equipment. In other words, with the help of this the index, the capacity of using equipment is measured.
2- TPM & TQM
As mentioned in the previous section, the first step to get to know the Overall Equipment Effectiveness (OEE) index is to know the words that make it up. In this part, we will describe Overall and related words.
What is the concept of being overall or total?
Today, we are faced with words such as total quality management, total productive maintenance, overall equipment effectiveness and concepts of this kind, in all of which comprehensiveness means a holistic and systematic look at the mentioned categories that we are going to describe.
What is Total Quality Management (TQM)?
Perhaps the term total quality management is one of the most common terms in the field of quality. Total quality management is to improve in work methods for survival in the current competitive environment.
The components of TQM are:
Total is a sign of its inclusiveness and comprehensiveness.
Quality refers to the degree of conformity of the finished goods or services with the customer’s needs.
Therefore, total quality management is the art of managing the entire collection to get the best outputs.
TQM is both a culture and a philosophy and a set of guiding principles to show the foundations of continuous improvement in the organization. Total quality management is a smart, calm and continuous action that has a significant impact on meeting the goals of the organization and finally, the level of customer satisfaction, efficiency and competition in the market are increases by TQM.
In total quality management, it is possible to point out the necessity of employee participation and also the system approach which is one of the principles of the quality management system.
this comprehensive approach means a systemic view of the organization and considering the role of each of the components (departments) to achieve quality. in other words, in the total quality management, all departments and organizational units participate in the Organization’s achievement of quality and customer satisfaction.
Implementation techniques of total quality management:
In total quality management, quality control groups will be formed voluntarily and with a specific purpose in each department of the organization, and they must be fully familiar with the current situation in the organization, work problems in various fields, including the quality of the operation process and product manufacturing, and use from practical tools and techniques to plan and solve these issues.
Among the tools that are used practically are:
- Check Lists
- Brain storming
- Histogram
- Cause and effect diagram
- Parato diagram
- Deming cycle (plan, do, check, act)
- Scatter plot
- Control chart
- 5S
- ISO 9001 Standard
- QFD (Quality Function Deployment)
- Suggestion system
Comparison of old and new quality culture
You can see differences between old and new quality culture in the following table:
| Elements of quality | Old | New |
| Definition | Product oriented | Customer oriented |
| Decisions | Short term | Long term |
| Emphasize | Inspection | Preventive |
| Source of error | Staff | System |
| Responsibility | Quality control unit | All staff |
| Problem Solver | Managers | Groups |
| Results | Price | Lifetime and partnership costs |
| Role of manager | Planning, assigning tasks, controlling, applying | Delegation, guidance, facilitator, coach |
What is Total Productive Maintenance (TPM)?
To maintain production at the highest level, in fact to survive production, manufacturers are increasingly required to shift from random maintenance thinking to productive maintenance theory. The method that is defined based on the proper training of human resources through a detailed program and is organized with the comprehensive participation of all the employees of the organization in the maintenance of the equipment. Total productive maintenance is a move towards a comprehensive teamwork approach to preventive maintenance and total quality management.
TPM is to improve productivity and without it, the survival of the company will be jeopardized. The most important part is a new partnership between manufacturing, maintenance, engineering and technical service manpower to improve what is called Overall Equipment Effectiveness (OEE), a program with the goal of zero downtime (caused by sudden equipment failure) and zero waste. It is through improving or reducing six types of common losses that may exist in production workshops. (This is explained in the following sections.)
TPM Principles:
- Improving equipment efficiency.
- Participation of operators in daily maintenance of equipment.
- Improving efficient maintenance.
- Education and training.
- Design and management of equipment with the purpose of preventive maintenance.
Comparison of TQM & TPM
In the table below, the evolution of quality and total maintenance is shown:
| TPM | TQM |
| Reactive repairs | After the purchase, the customer inspects the product. |
| Preventive Maintenance | Pre-shipment inspection |
| Anticipated maintenance | Quality department and use of statistical quality control tools |
| Teamwork | Operators use quality control tools. |
| Total productive maintenance | Total quality management |
As it is clear from the comparison table, nowadays a comprehensive approach prevails in various areas from quality to maintenance and repairs. The Overall Equipment Effectiveness (OEE) index also includes all the factors influencing the effectiveness of the equipment and in the calculation of this index all the factors that can It is considered to affect the effectiveness of the equipment, such as stoppages, reducing speed and quality.
3- What is the history of OEE (Overall Equipment Effectiveness)?
Overall Equipment Effectiveness (OEE) tries to measure all the influencing factors on the capacity of the equipment in order to check if the equipment meets the set goals? for example, if a machine is purchased that has a daily production capacity of 1000 pieces, does this machine actually have the capacity to produce 1000 pieces? Also, identifying all the factors that are involved in not using the capacity and the impact of each of them will help us in measuring and analyzing the effectiveness of the entire equipment. This index is expressed as a percentage. If this index is 70% for a device, it means that 30% of the capacity of the device has not been used.
The history of OEE
Equipment effectiveness was first used in the 1960s by Seiichi Nakajiama at Nippon Denso. Mr. Nakajiama used this index as a critical key in Total Productive Maintenance (TPM). According to Nakajiama, TPM is a factory improvement methodology that enables rapid and continuous improvement of the production process. They do this by involving employees and workers, empowering them and measuring the results continuously and related to each other. In the mid-1990s, Sematech company, whose industry is in the field of semi-conductive fiber production, agreed to use the OEE to improve the productivity of their factories. After that, manufacturers of other industries all over the world embraced the methodology of OEE and applied it to improve production efficiency and also improve the efficiency of their assets.
OEE is the benchmark used for TPM programs. Determining the level of Overall Equipment Effectiveness (OEE) is obtained by measuring the efficiency of the equipment. Measuring the equipment effectiveness should be done beyond the available time or the machine’s activity time and should include all the items with the efficiency of the equipment.
The formula for equipment effectiveness should consist of available time, performance and quality. In this way, it is possible for all units of the organization to participate in determining the effectiveness of the equipment. This formula is shown as follows:
Equipment Effectiveness = Available time × Performance × Quality
4- Six major losses
One of the most important goals of OEE and TPM is reducing or removing that thing which is called six major losses. These losses are major reasons for creating waste in Overall Equipment Effectiveness (OEE). These six losses are divided into 3 parts that each category of them is assigned to one of these factors: Availability, Performance and Quality.
Equipment failure
Failure of equipment is one of the important factors affecting the effectiveness of equipment. Some related factors are:
- Not considering maintenance plans
- Total failure of production line
Waste of time due to commissioning and setting up devices
The settings and time required to set up the equipment have a direct impact on the effectiveness of the equipment. Some of the factors influencing the setting and setup time are:
- Setting or change
- Shortage of raw material
- Shortage of human resource
- Time to prepare the device
Short stops
During the time of working with the device, there are usually many short stops that, despite its short duration, have a significant impact on the equipment effectiveness due to repeated repetitions. Examples of these stops are:
- Slowing down the flow of production
- Jamming of components
- Inappropriate feeding
- Failure of sensors
- Non-delivery of the product
- Time to prepare the device
Work at low speed
The speed lower than the power of the equipment is one of the factors that is usually not considered and becomes a chronic problem. Some of its factors are:
- Improper initialization.
- Determination of low nominal capacity.
- Low design capacity.
- Wear and tear of equipment.
- Inefficiency of operators.
- Not knowing the capabilities of the equipment and how to work with them.
Wastes and rework
In many cases, a lot of production time is wasted due to wastes and rework. Examples of it are:
- Production of wastes parts
- Production of parts that need to be reworked
- Incorrect assembly of parts
Wastes caused by starting equipment
The time spent on the production of waste material that occurs during the preparation of the device, its start-up or the initial stage of production, which is significant in many cases. Examples of which are:
- Startup wastes
- Production of defective parts at the beginning of the line
5- Equipment Availability Index
What is availability?
The first step in calculating the effectiveness of the equipment is the time when the equipment is ready for production, that is, when the equipment is not stopped and available for production. These stops include planned and unplanned stops. We use the following relationship to calculate the availability index.

For a better understanding of the availability index, the following figure can help. As you can see in the figure, we have a total time, which can be a day, a week, a month, or a year. Settings for labor absence, raw material failure, power outage, etc. are stopped, some of them are planned stops and some are unplanned stops. If we subtract the total time of these stops from the total time, the available time is obtained.
| Total Time | |
| Available time | Stops |
For example, if we have a 6-hour stoppage in a working day, when there are 24 hours for production, the equipment availability index is 75%, or in other words, we have not used 25% of the equipment capacity, and we can check the causes of the stoppages. And to solve them, add up to 25% more to the capacity of our equipment.
Stoppage fees
A lot of costs are imposed on the organization due to stoppages, which are mentioned in a few cases.
- The cost of idle manpower when the machine stops.
- Late fees or customer penalties due to late delivery.
- The cost of customer dissatisfaction.
- Interest rate cost of capital, for example, if we have a device that is stopped 67% of a year, and this machine costs 100,000$, it is like we have kept 100,000$ of the company’s capital in the company’s fund for 120 days without using it, which if the capital interest rate is 20%, 6,666$ will be the cost of capital stagnation.
- In accounting, the cost of depreciation of equipment and buildings are calculated annually, and it is included in the final price. As mentioned in the case of fixed costs, in case of stopping and non-production, the share of this fixed cost in the cost price of the product unit will increase.
Types of Stoppages
In the classification of stops, we divide them into two groups: planned stops and unplanned stops, examples of which are mentioned below.
Planned stops:
- PM
- Setup
- Rest times
- Planned holidays
Unplanned stops:
- Incidental repairs
- Absence of manpower
- Deficit of raw materials
- Power outage
- Quality problems
Important points when buying equipment
- Investigating product life cycle costs
- The time required to setup the equipment
- Maintenance capability
Should the total time of 24 hours be taken into account when calculating the availability index?
Scheduled times do not include planned stoppages such as closed work shifts in the total time. that’s mean:
| Total Time | |
| planned time | Planned stops |
| Available time | Stoppages |
For example, if a company works in two 12-hour work shifts and another company only works in one 12-hour shift, and the stoppages of each work shift are on average 2 hours, then the equipment availability index of these two companies will be:
| Availability | two 12-hour work shifts | one 12-hour Work shift |
| Availability Index (planned approach) | 83% | 83% |
| Availability Index (24 hours approach) | 83% | 43% |
As can be seen, in the planned method, the equipment availability index of the two companies will be equal, while the company that works in two shifts works more effectively, but in the 24-hour method, this difference is clearly visible. Therefore, using the planned method eliminates the possibility of comparing companies with each other. Also, the management of an organization will never be informed of the importance of lost economic opportunities and the fact that a significant part of the capacity is empty, and will be misled by high index numbers. Considering the above argument, the intensification of competition at the international level and its non-negligible effect on the cost price, despite the existence of numerous sources, we still strongly recommend the 24-hour method.
Connection between Six major Losses and Availability
As mentioned in the previous section, the failure of the equipment and the loss of time due to the setup and adjustment of the devices were mentioned as 2 of the 6 major losses, and these two major losses are factors affecting the availability index and the duration the stop time caused by them is included in the calculations.
6- Equipment Performance Index
Performance
The performance index compares the amount of production in the available time with the capacity and capability designed in the device. To calculate the performance index, we use the division of the actual production by the amount of standard production in the available time, that is, if the actual production in the available time is 900 pieces, but the amount Standard expected production is 1000 pieces, so the performance index will be 90%.
| Total Time | |
| Available time | stops |
| Real time production | Reduce speed |
As explained about the availability index, the factor that decreases this index is the stops, but the main factor in the decrease of the performance index is unrecordable small stops or working at a low speed. In other words, there may be small stops periodically during the working time which is not recorded anywhere due to the high frequency, they may have a significant contribution to the reduction of the performance index. For example, due to improper placement, the production operator may have to take a short time to get a tool periodically during spending a shift that this time is not recorded anywhere, also working at a speed lower than the capacity of the machine is another factor of reducing this index. Performance index has the following formula:
Reasons of low performance:
- Lack of trained operators
- Inability of operators
- Lack of proper methods and instructions
- Wrong way
- Not knowing the capabilities of the device
- Wear and tear of devices
How to improve performance index:
The important point here is to identify the anticipated capacity of the device in its design or the maximum capability of the device, which can be accessed through its documentation, catalogs, or previous records. After determining the ideal time, you should modify the method of doing work or training operators to bring the real time closer to the ideal time.
Try to discover the factors that make you unable to make the most of the device’s power with comprehensive reviews. For this purpose, it can be useful to carefully observe the work process and use work and time study methods.
What is work study?
Work study is a general term for all the techniques that are used in order to examine human work in all fields and systematically make all the effective factors in the efficiency and economicness of the desired situation to be examined and in the result of improvement will be created. Method study and work measurement are two work study techniques. According to the above definition, work study is directly related to productivity. In most cases, this technique is welcomed in order to increase the amount of the product, according to the certain amount of resources, without causing a large investment cost.
Increase productivity with work study
There are many effective factors in productivity, and they are different depending on the type of organization. Obviously, productivity can be increased by investing more and buying more modern equipment and machines, but this requires a lot of investment. If we want to increase productivity by using available resources, the use of work study will be very effective.
Why is work study valuable?
Some aspects of the nature of work study and why it is such a valuable tool for management are summarized as follows:
- Work study increases the efficiency of production (or the productivity of the factory or operating units) by reorganizing work, and it is a method that needn’t naturally invest on equipment and machinery a lot.
- It is a systematic
- It is the most accurate method that has been created so far to determine performance standards and these standards are necessary for effective production planning and control.
- The benefits resulting from the correct application of the work study started immediately and these benefits will continue until the operation continues in an improved form.
- Work study is a tool that can be used everywhere. This technique is applicable in all places where manual work is done, such as factories, offices, stores, laboratories, service industries, such as wholesale and retail distributors, restaurants and farms.
- It is one of the most penetrating inspection tools available to the management, and this makes it a valuable weapon for starting an attack on ineffective points in an organization.
The main stages of work study:
There are eight steps to fully implement the work study, which are:
- Select the job or process to be studied.
- Record all the events that happen using direct observation. For this purpose, the most appropriate recording techniques are used, and therefore, the information in the most appropriate form will be prepared for analysis.
- Examining the recorded events with a critical view of everything that is done and paying attention to things such as the purpose, the activity, the place where the activity is carried out, the sequence of doing it, the person who does the activity and the person’s intention to do that activity.
- Providing the most economical method considering all environmental conditions. (Develop)
- Measuring the amount of work done by the chosen method and calculating its standard time.
- Defining the new method and its related time.
- Implementation (Install) of a new method that is consistent with standard work and time allowed.
- Maintenance of new standard work by appropriate control procedures.
Connection between Six major Losses and Performance
Earlier, short stops and working at low speed were mentioned as 2 out of 6 major losses, and these two major losses are factors affecting the performance index and cause the machine to not be able to have the maximum production rate.
7- Quality index
If there is a lot of wastes and rework in an organization, it means that we have wasted the organization’s time and resources.
| Total time | |||
| Available time | Stops | ||
| Real production time | Reducing Speed | ||
| Healthy production | wastes and rework | ||
As can be seen in the above figure, considerable time may be spent on the production of low-quality products that in addition to the costs mentioned in previous parts, the cost of the damaged and unusable product should also be added. The quality index is calculated by the following formula:

What measures are necessary to reduce quality problems?
Low-quality raw materials can cause problems in all stages of production or the FGs. In order to solve this problem, in addition to partnering with suppliers, it is necessary to stop choosing suppliers based only on price. To solve quality problems in other stages of production, after identifying the amount and causes of wastes, using problem solving methods, putting the processes under control and using error-proof methods.
Effective tools in improving quality: (Tools for controlling processes)
Check Lists
Checklists are collected and used in a specific format to form data and events related to the operational process or product. Checklists are generally used in two ways:
- Checklists related to process distribution
- Checklists for recording issues and causes of errors
Brain Storming
Brainstorming is one of the important and simple methods used to objectify potential talents and create new ideas. In this method, the people who come together each propose an idea, and the proposal of each idea causes the association of new ideas in the minds of other members of the group.
In this method, one member of the group is responsible for recording all the ideas presented. Then, the agreed ideas are categorized and determined as the agenda of the group meeting based on priority, and the problem is analyzed and the solution is presented. It is important to note that in order to get the desired result from this method, first of all, the meeting space must be prepared for presenting the points of view of all members, secondly, the fear of mocking others among the group members has disappeared, and thirdly, the group leader or the person in charge of the meeting has the power to summarize and lead the meeting as well.

Histogram
A histogram is a type of bar chart that can be used to describe continuous data. In a histogram chart, the frequency of the variables related to the subject or the investigated problem is classified in a certain domain, so that they can be understood and analyzed more easily. To prepare a histogram, it is necessary to observe the following principles:
- Collect and record data
- Domain determination
- Determining the distance between floors
- Determining the boundaries of the classes
- Frequency table setup
- Charts
- Record the data in the chart
- Register histogram properties
Cause and effect diagram (Fish bone diagram)
It is used to identify problem symptoms in all production and service processes.

Parato Diagram
The Parato chart or the 80-20 rule was first proposed by the Italian economist Wilfrid Parato. He believed that 80% of the wealth of a society is owned by 20% of the people of that society. Therefore, if the income of 20% of the people in the society is paid enough attention, 80% of the money circulation of the society can be calculated.
This law can be easily used in the issues and problems of the production and service unit and to prioritize and determine the importance of each problem. For example, most of the breakdowns of production equipment are related to a part of the machinery that is repeated frequently.
Now, if instead of basic repair and inspection of all parts of the equipment, we pay more attention to the part that is constantly damaged, in addition to fixing the defect and preventing the repetition of the error, the time and cost of the repair will be saved. In relation to human resources, it can be claimed that in a production or service unit, generally 80% of errors are made by 20% of the organization’s employees, so if enough time is devoted to this category, an important part of the organization’s problems will be solved.
PDCA Cycle
The cycle of Planning, Doing, Checking and Act is a practical method for the success of quality control groups. Its purpose is continuous improvement of operation processes and prevention of defects.
Scatter Diagram
There are many factors that affect each other in a production or service environment, such as the effect of staff satisfaction on increasing productivity or production technology and production efficiency rate. A scatter diagram is one of the simplest diagrams that easily depicts the relationship between two variables.
This chart is used in the following three ways:
- Relationship between variables
- The relationship between cause and effect
- Correlation of two variables
Control Chart
A control chart is a visual chart that shows the possibility of analyzing the data obtained from the performance of the operation process or the product. This chart can show the changes that happen in the production process with using statistical methods.
Connection between Six major Losses and Quality
Earlier, wastes and rework were mentioned as 2 out of 6 major losses, and these two major losses are factors affecting the quality index. Defective parts not only waste time and reduce effectiveness, but also lead to other high costs such as rework costs.
8- OEE (Overall Equipment Effectiveness) index?
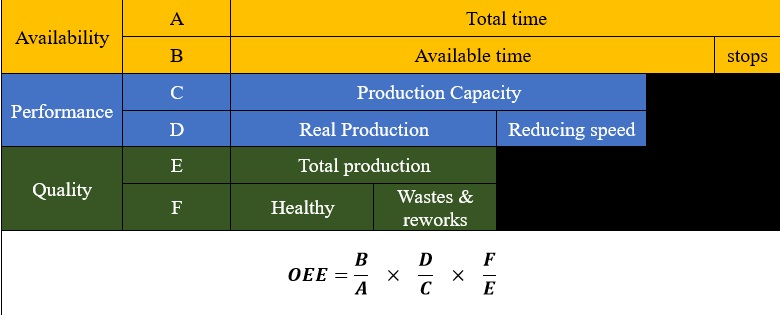
The Overall Equipment Effectiveness (OEE) index is the product of three indicators: availability, performance and quality. In other words, any factor that reduces the effectiveness of equipment can be classified in these three categories.
OEE = Availability × Performance × Quality
One of the advantages of this index is its comprehensiveness, and the activities of all organizational units play a role in this index. For example, if the sales unit cannot receive enough orders from customers, the production will be stopped, and as a result, the Overall Equipment Effectiveness (OEE) index will decrease. Or consider that the procurement unit cannot provide raw materials or spare parts on time, the Overall Equipment Effectiveness (OEE) index will decrease. Also, this index has created coordination between organizational units, and its increase can be a common organizational goal. For example, in many cases, the production unit, without considering the quality, only thinks about increasing the production statistics, and the reason is that production statistics have always been the criterion for measuring this unit, now by replacing the Overall Equipment Effectiveness (OEE) index, this problem is solved It will also become important for the production unit, because the production of defective products will reduce this index. Also, the quality unit will give more value to the production statistics and pay attention to the quantity in addition to the quality.
Reaching the world level in Overall Equipment Effectiveness (OEE)
Overall Equipment Effectiveness (OEE) index is a strict test. For example, if each of the basic factors has a value of 90%, the value of 72.9% will be obtained for Overall Equipment Effectiveness (OEE) index. That is, to reach the high value of Overall Equipment Effectiveness (OEE) index, all the factors must have their highest value. Practically, in order to achieve the goal of reaching the global level in this index, each of the factors must reach a value completely different from each other, and these values are given in the table below.
| OEE Factor | World level in OEE |
| Availability | 90% |
| Performance | 95% |
| Quality | 99.9% |
| OEE | 85% |
These values have a different value for each manufacturing plant. For example, if a factory has implemented a six-sigma program to improve quality, obtaining a value of 99.9% for the quality of manufactured products is not so satisfactory. By reaching this number, it is placed in an acceptable and standard position. Extensive studies conducted worldwide indicate that the average level of Overall Equipment Effectiveness (OEE) index for manufacturing plants is about 60%, while by considering the above table, we realize that the percentage of this index to be in the world class is 85% or more.
9- Quality management and OEE standards?
- According to the fourth item of the quality management standard in relation to the organization’s processes:
- Every organization should identify the processes required by the quality management system and their application in the entire company.
- Every organization should determine the sequence and mutual effects of these processes.
- Every organization should determine criteria and methods to ensure the effectiveness of implementation and control of these processes.
- Every organization should ensure the availability of resources and information needed to support the implementation and monitoring of these processes.
- Every organization should monitor, measure and analyze these processes.
- Every organization takes the necessary measures to achieve the planned results as well as continuous improvement of these processes.
According to the standard, the processes of the organization must be monitored, measured and analyzed, and OEE index or its components (Availability, Performance, Quality) can be suitable indicators for monitoring related processes.
- According to the standard of the organization, you must determine the quality goals.
Top management must ensure that quality objectives, including those required to meet product requirements, are established for relevant functions and levels of the organization. Quality objectives should be measurable and consistent with the quality policy.
The OEE index or its components can be determined and improved as quality goals. For example, consider the following quality goal.
10% increase in the overall equipment effectiveness index in the next 1 year.
- Data analysis is mentioned in item 8-4 of the standard.
The organization must determine, collect and analyze appropriate data to show the effectiveness of the quality management system and evaluate in which places continuous improvement of the effectiveness of the quality system can take place. Data analysis should provide information on:
- Customer satisfaction
- Compliance with product requirements
- Characteristics and orientation of processes and products
The OEE index or its components can provide useful information for data analysis.
- According to item 8-5 of the quality management system standard, continuous improvement is a requirement.
The organization should continuously improve the effectiveness of the quality management system through the use of quality policy, quality objectives, audit results, data analysis, corrective and preventive measures and management review. Improvement opportunities can be identified by using the information of OEE index. For example, by using availability index trends, preventive measures can be determined to prevent stoppages.
- In paragraph 3-6 related to the infrastructure in the ISOTS16949 technical specification, there is a reference to the principles of lean production, and the OEE index is one of the tools used in lean production.
Lean production is actually a philosophy and attitude that aims to remove and eliminate any additional process from raw material preparation stage to production and finally sale that creates added value.
10- Six-Sigma and OEE (Overall Equipment Effectiveness)
Sigma is one of the letters of the Greek alphabet and in the science of statistics, it is one of the important indicators of scattering called standard deviation, and it is actually a scale for measuring deviation; Sigma indicates how much a process has deviated from its desired state, so it is actually a metaphor for extreme accuracy in reducing quality costs, which emphasizes the importance of accurate calculations in the production and service delivery process. to give Six-Sigma means reaching a level of product quality and service delivery that reduces work process errors by 3.4 in a million situations.
Six-Sigma is an organizational transformation strategy. The transformational strategy of six-sigma is a system that leads to the development and expansion of management, statistical methods and ultimately solves problems and allows the company to make leaps and transformations.
Six-Sigma is a philosophy of continuous improvement and moves towards excellence in everything. Six-Sigma is a system that determines where we are, where we want to be, how we will get there and how we will improve along the way.
In the six-sigma program, everything that is contrary to the satisfaction of customers and their intended usefulness is called waste. The six-sigma strategy includes the use of statistical tools in the form of a structured method to achieve the knowledge required in today’s competitive world, to produce products and provide better services, faster and at a lower cost.
Six-Sigma is a systematic and dynamic approach to guide information and a methodology to eliminate waste; With the aim that six-sigma is in our distance between the lower and upper characteristic limits of the target value. Six-Sigma programs are used for any process, from manufacturing to any operational process and even for service services.
Six-Sigma is a comprehensive methodology of effective organizational improvement that has a structure, program and powerful quality management tools. The six-sigma approach is to clearly reduce all errors of the organization and reach the level of six sigma in errors. In this regard, we need to pay attention to the following points:
- To reach six-sigma, we have to go through the previous stages and levels of sigma.
- The purpose of reducing errors in the organization is to reduce errors in processes, not in people.
- The Six-Sigma approach is used to identify and eliminate errors in processes in the DMAIC cycle. This cycle can be considered as an effective improvement cycle in Six- Conceptually, this cycle can be considered the same as PDCA (Plan, Do, Check, Act) and PSDA (Plan, Study, Do, Act) improvement cycles, but in DMAIC cycle, a very operational error reduction cycle based on accurate monitoring is implemented. This cycle consists of the first letter of the word’s Definition, Measurement, Analysis, Improvement and Control.
In describing this cycle, it should be said that any error reduction starts from the correct definition. Measurement in the methodology of the DMAIC cycle after defining the issue shows that the emphasis of six sigma to explain the existing situation in order to improve it. Measurement leads to the formation and detection of information flow in the process and can determine the level of errors and trends and at a higher level and their priority. Using the information from the previous section, the analysis will find the root causes of errors in the process. One of the common errors in organizations is failure to recognize the main factors and roots of errors. Improvement is the stage in which the necessary answers to the questions raised in the previous stages are formed. Reducing the error towards the formulated goals and measuring the initial results after implementation is one of the improvement methods related to this stage. Control can be seen as a stage in the continuity and consolidation of improvement.
In the following, we will explain the role of the Overall equipment effectiveness (OEE) index in the different stages of six sigma:
- Identification
Availability, quality and performance indexes can clearly show system issues and problems and can be a good start for an improvement project.
- Measurement
The mentioned indexes are calculative and can be a suitable criterion for measurement. For example, waste values or a specific stop or … can be achieved in the OEE index.
- Analysis
The information obtained from the calculation of the OEE index can help a lot to analyze the root of the problems.
- Optimization
The OEE index provides the possibility to see the impact of improvement in the system, and we can see the improved indicators with calculation scales.
- Control
The OEE index provides the possibility of observing, tracking and directing the process to control it.
- OEE (Overall Equipment Effectiveness) calculation
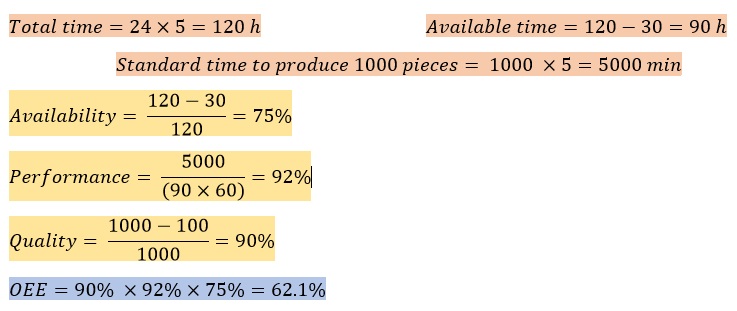
Example1:
Machine A produced 1000 pieces in 5 days. If the total stoppages are 30 hours and the standard production time is 5 minutes, and 100 production pieces are defective. What is the OEE index of the device?
Answer:
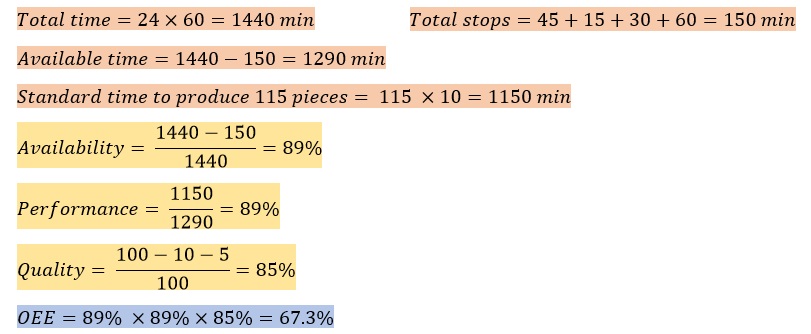
Example2:
Machine 1, which has a standard production time of 10 minutes for one piece, has the following stops during the day, and its production statistics are according to the table below. Now calculate the index of this device.
| Stoppages | |
| Setup | 60 min |
| EM | 30 min |
| PM | 15 min |
| Lunch | 45 min |
| Production statistics | ||
| healthy | wastes | reworks |
| 100 | 10 | 5 |
Answer: