
In the core-making line of Balin tech (Peugeot France Cylinder producer (
Real-Time Data Monitoring was successfully implemented, with an evaluation indicating the potential for efficiency improvements ranging from at least 1% to 15% in this production line.
1- Overview of the Core-Making Production Line
2- Existing Challenges in the Cylinder Head Core-Making Production Line
3- Identification of Suitable Machines for I IoT Hardware Installation
4- Comparison of Various Electronic Hardware Options for Machine Connectivity and Selection
5- Evaluation of Monthly Performance Report Preparation and Review of KPIs in the Production Line
6- List of Downtimes Based on Company Standards
7- Preparation of a 3D Layout Map of the Factory for Management Dashboard Development
8- Installation of Edge box SFPM10 Hardware on CM 05 08 and CM 05 16 Machines
9- Definitions and Standards for OEE Calculation in the SFP Software
10- Comparison of Data, Statistics, and Charts Generated by the Current Systemwith Traditional Methods, and Conclusion
11- Methods for Improving Production Efficiency
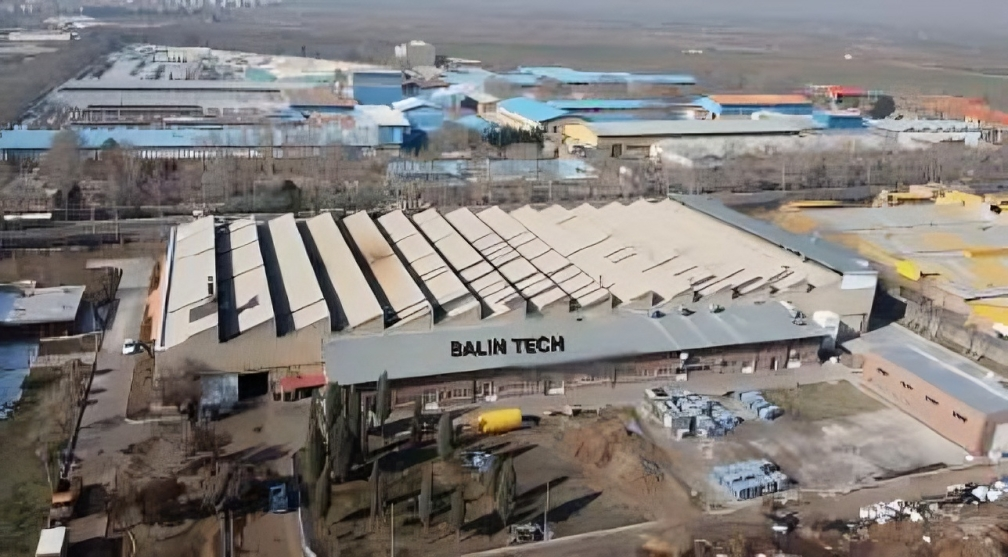
1-Overview of the Core-Making Production Line
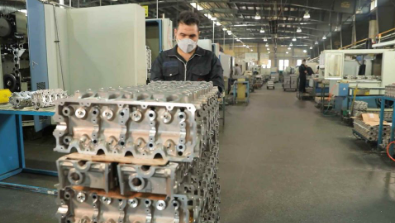
This production line, with more than 150 personnel and 22 machines, is one of the largest core-making lines. It is capable of producing 65 types of cores required for automotive cylinder heads. The line is considered a critical bottleneck in Balin tech’s manufacturing facilities. Due to the workflow, scheduling, and product traffic, this line typically operates 24/7. Any downtime in this line would result in disruptions across the entire factory’s production.
2-Existing Challenges in the Cylinder Head Core-Making Production Line

Overall, the core-making production line at Balin tech is effectively managed thanks to the creative vision and extensive experience of the company’s leadership. Production staff, managers, planning personnel, and quality assurance teams jointly ensure optimal control of production efficiency and product quality.
This does not mean the company has stopped progressing. On the contrary, with a positive outlook, management welcomed the HB Smart Factory team, enabling better access to production data and embracing any form of optimization. Throughout multiple sessions, it became clear that production managers are highly receptive to innovative processes that can enhance workflows and improve efficiency.
As the core-making line is a bottleneck for the foundry line, it always operates with standby capacity. To ensure the foundry line continuously receives the required feedstock, some machines are kept on standby and activated only when necessary.
However, aging equipment, a dusty environment, and high operating temperatures have negatively affected both the machinery and operators, creating unfavorable conditions for optimization efforts—conditions inherent to this type of production line.
Another challenge lies in the absence of global standards for measuring quantitative production indicators. While Balin tech has implemented multiple quality management systems to guarantee product quality, only a limited number of quantitative efficiency metrics have been evaluated so far. This Case Study will also address those indicators.
Additionally, delays in reporting production data and downtime statistics presented significant issues, as operators often recorded such information with delays ranging from one to several days.
Lastly, weak internet connectivity (due to the factory’s location outside the city) and frequent network interruptions—up to 50 disconnections per minute—made the use of hardware connected directly to production machines impractical.
3-Identification of Suitable Machines for I IoT Hardware Installation
Overall, the core-making production line at Balin tech is effectively managed thanks to the creative vision and extensive experience of the company’s leadership. Production staff, managers, planning personnel, and quality assurance teams jointly ensure optimal control of production efficiency and product quality.
This does not mean the company has stopped progressing. On the contrary, with a positive outlook, management welcomed the HB Smart Factory team, enabling better access to production data and embracing any form of optimization. Throughout multiple sessions, it became clear that production managers are highly receptive to innovative processes that can enhance workflows and improve efficiency.
As the core-making line is a bottleneck for the foundry line, it always operates with standby capacity. To ensure the foundry line continuously receives the required feedstock, some machines are kept on standby and activated only when necessary.
However, aging equipment, a dusty environment, and high operating temperatures have negatively affected both the machinery and operators, creating unfavorable conditions for optimization efforts—conditions inherent to this type of production line.
Another challenge lies in the absence of global standards for measuring quantitative production indicators. While Balin tech has implemented multiple quality management systems to guarantee product quality, only a limited number of quantitative efficiency metrics have been evaluated so far. This Case Study will also address those indicators.
Additionally, delays in reporting production data and downtime statistics presented significant issues, as operators often recorded such information with delays ranging from one to several days.
Lastly, weak internet connectivity (due to the factory’s location outside the city) and frequent network interruptions—up to 50 disconnections per minute—made the use of hardware connected directly to production machines impractical.
For example, the production steps of an automotive cylinder water jacket are carried out as follows:
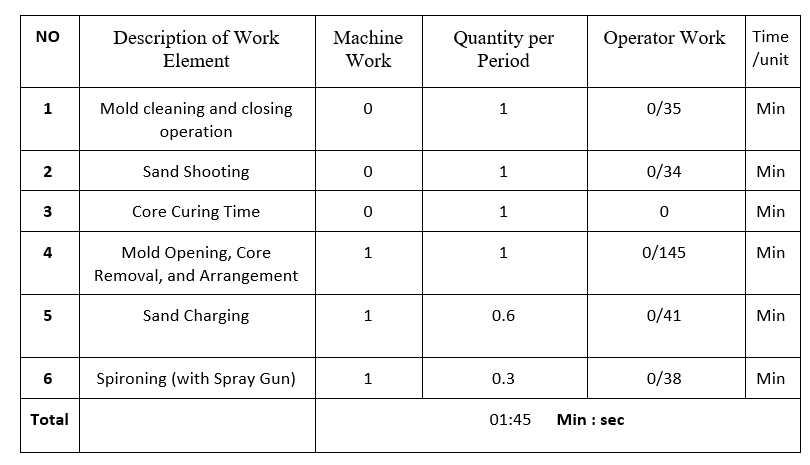
All of these steps are required for producing a single core. From this, we conclude that sending one signal per minute is sufficient. However, if the production speed exceeds ten pieces per minute, the signal frequency can be increased to one per second, or alternatively, production counts can be aggregated every five minutes before sending a signal
In other words, even if the machine generates two signals within less than 60 seconds, the software will still interpret this as one piece, since it is technically impossible to produce more than one part in under this time frame.
4-Comparison of Various Electronic Hardware Options for Machine Connectivity and Selection
Hardware Comparison
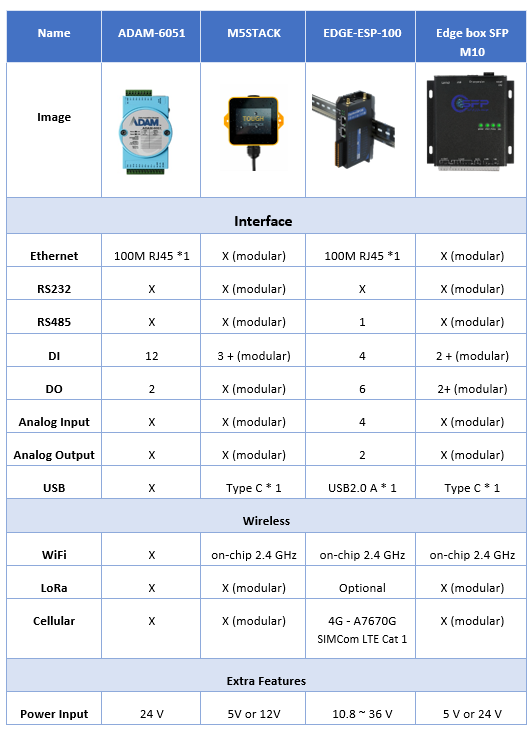
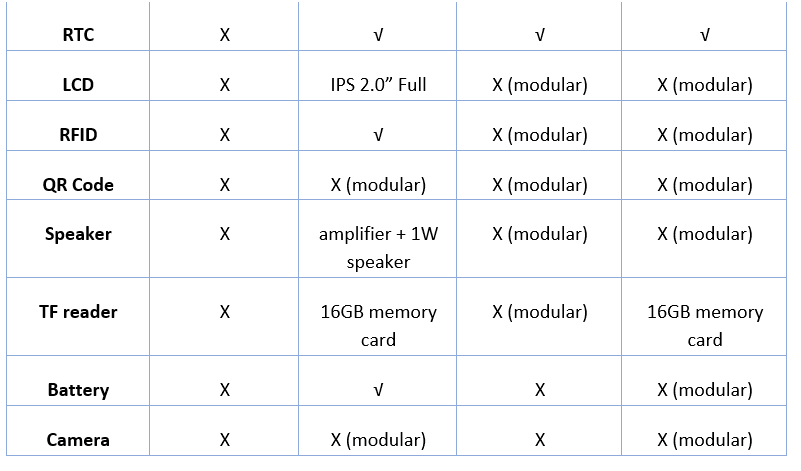
There is a wide variety of available hardware solutions, but in this project, the main priorities were cost-effectiveness and quality. Since most of these devices are based on Industry 4.0 standards, a significant portion of their capabilities are similar.
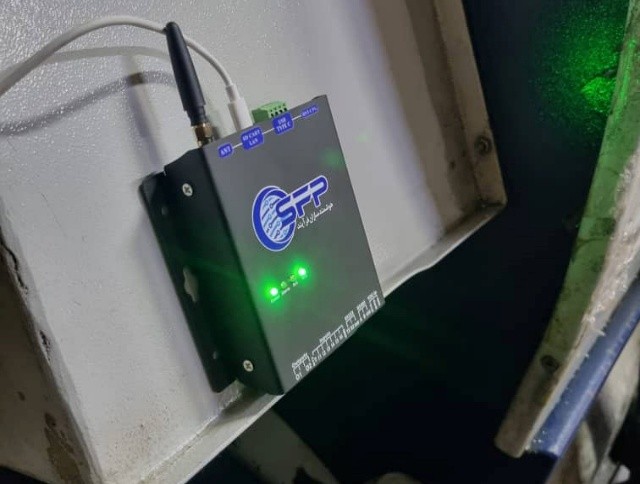
The Edge Box SFP M10 hardware, developed by HB Smart Factory, was identified as the most suitable option due to its low cost, the availability of output ports that enable connection to multiple machines simultaneously, and the built-in antenna that allows seamless integration with the existing Wi-Fi network in the production hall.
Given the large size of the production facility, the antenna capability eliminates the need for frequency amplifiers. Moreover, the Edge Box SFP M10 hardware has been adapted to local industrial conditions, where frequent internet disruptions are common. It is capable of storing data for up to 30 days and automatically synchronizes with the software once the internet connection is re-established.
5-Evaluation of Monthly Performance Report Preparation and Review of KPIs in the Production Line
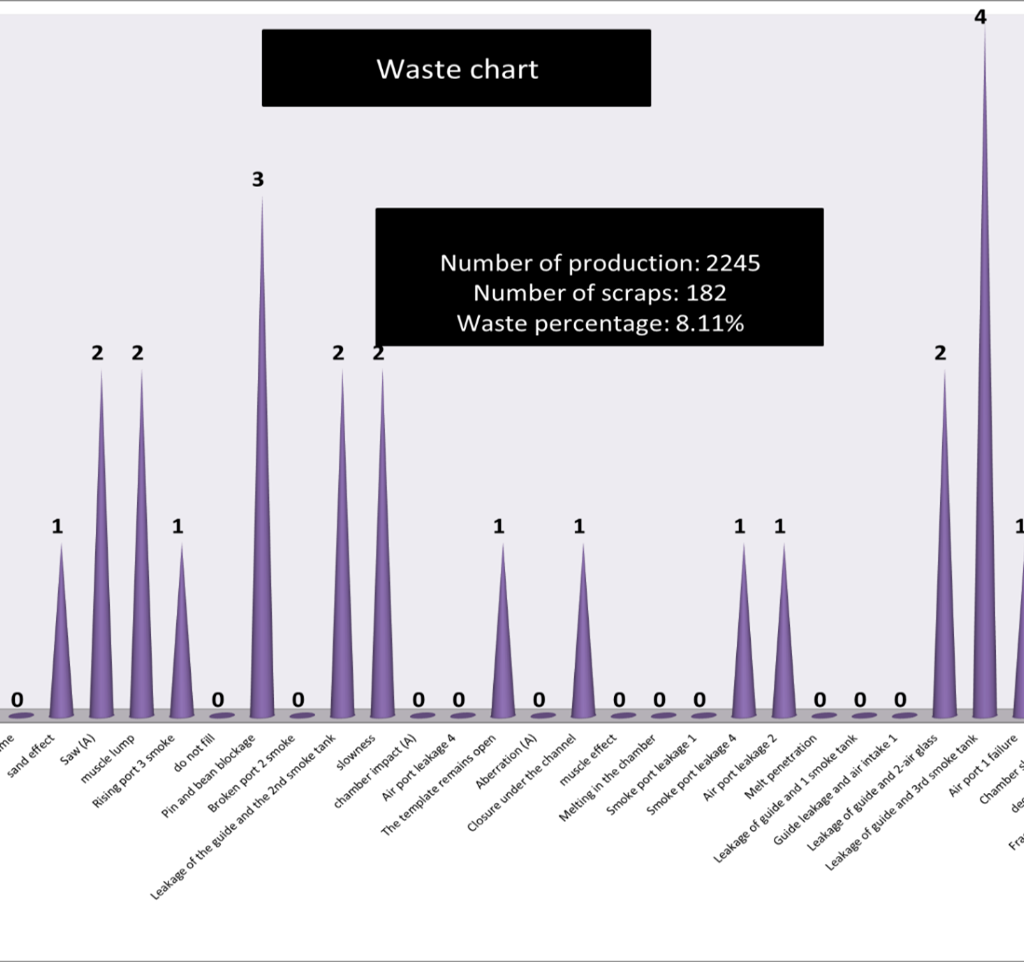
The most important parameter monitored by Balin tech’s production managers is the percentage of plan fulfillment. Due to the nature of foundry cores, scrap generated during production can easily be recycled back into the line and reused as raw material. All causes of scrap generation are collected and categorized. on a daily basis, as illustrated in the following figure:
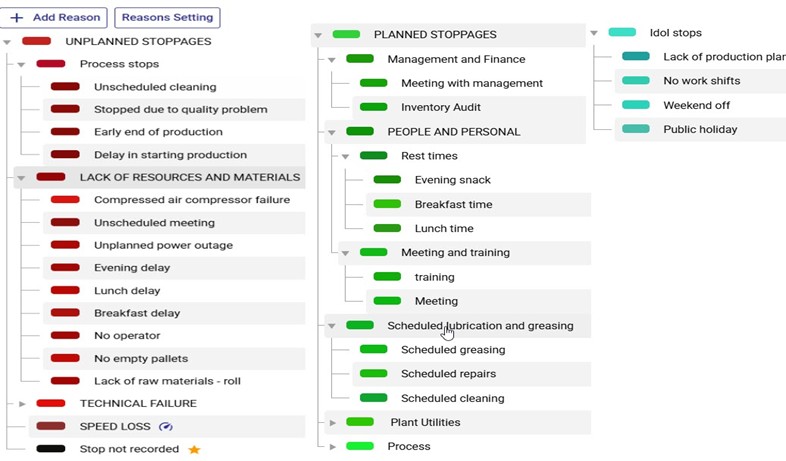
6-List of Downtimes Based on Company Standards.
There are three standard categories of stoppages for OEE calculation, which must be defined for each manufacturing line based on its specific needs here is example for this factory.
7-Preparation of a 3D Layout Map of the Factory for Management Dashboard Development
observed the existing machines, and prepared a 3D model of the production line, which was then included in the Home page of the software
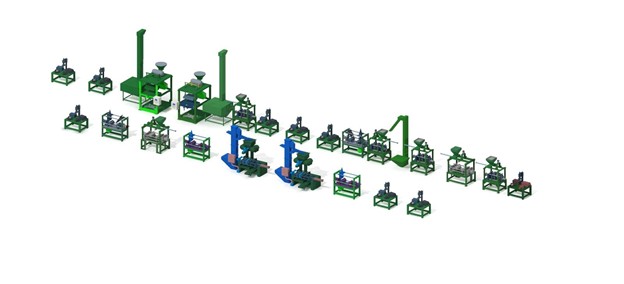
The above management dashboard helps managers quickly and clearly access the desired machine and view the related information with an attractive interface and under full control during management meetings. Normally, the monitor is installed at the entrance of the production hall, but at the request of Balin tech managers on other was installed in the production manager’s office.
8-Installation of Edge box SFPM10 Hardware on CM 05 08 and CM 05 16 Machines
the hardware for the old and worn-out machine was installed next to the machine’s control panel, and the input signal from the core shooter’s contactor was connected to the SFP hardware. Since no 12–24V power supply was available in the control panel, a step-down adapter was installed inside the panel. In addition, the Edge Box can be easily adjusted and connected to a cellphone through a simple setup, with the application already installed on it.

9-Definitions and Standards for OEE Calculation in the SFP Software
the hardware for the old and worn-out machine was installed next to the machine’s control panel, and the input signal from the core shooter’s contactor was connected to the SFP hardware. Since no 12–24V power supply was available in the control panel, a step-down adapter was installed inside the panel. In addition, the Edge Box can be easily adjusted and connected to a cellphone through a simple setup, with the application already installed on it
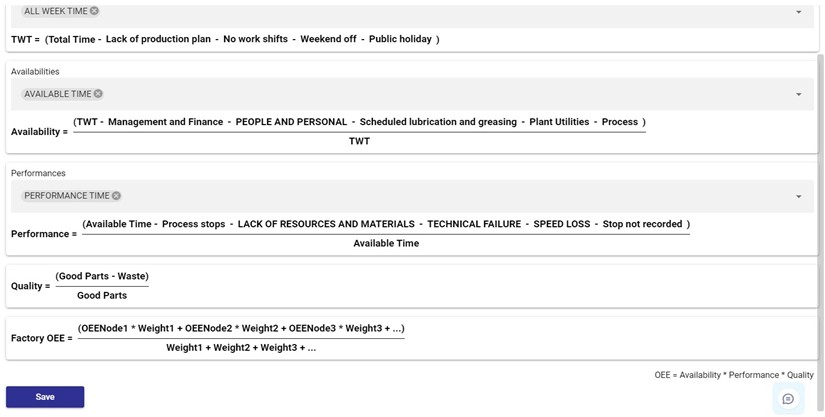
OEE Calculation formula OEE = Availability × Performance × Quality
For calculating the OEE of the production line, weights can be assigned to each machine in every period according to the company’s financial and statistical policies. In other words, a weighted formula can be applied to each machine.

10-Comparison of Data, Statistics, and Charts Generated by the Current System with Traditional Methods, and Conclusion
In fact, using this method, the conditions before and after the implementation of the SFP system can be measured, showing how machine efficiency can be increased by 1 to 15 percent.
For example, an analysis of machine CM 05 08 revealed that in week 20, during which the machine was operating for all seven working days, its OEE was 72.91%. This measurement continued for one month, resulting in an average machine efficiency of 73%. As indicated by the color coding of the three measured parameters, in week 20 the performance parameter must be improved by 8.6% to reach the global standard of 95%. Similarly, the availability of the machines needs to be increased by about 5% to reach the global benchmark of 90%. The quality factor, however, is already at a very satisfactory level, which is particularly important in the automotive parts manufacturing industry.
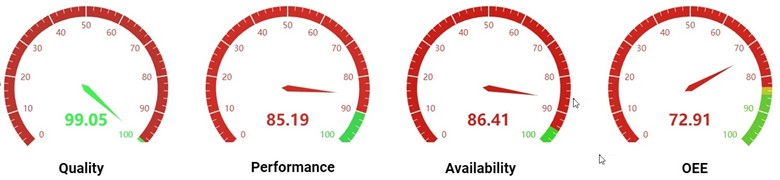
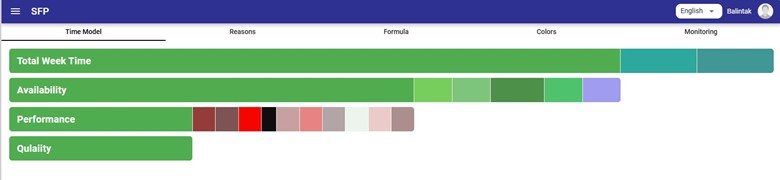
The color coding of these indicators is designed to clearly reflect the machine’s efficiency status, with the quality parameter shown in green due to its satisfactory level.
The software provides the capability to analyze each machine over a defined period. For example, during the month of September, the efficiency of this machine was measured at 73%.
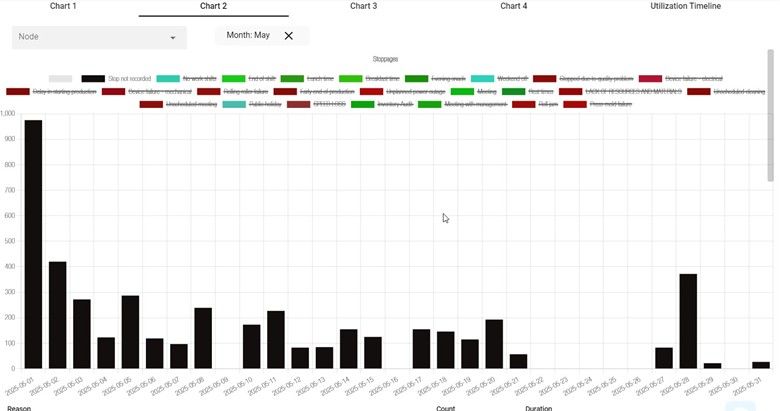
The reasons for stoppages in the month of MAY have been automatically recorded in the graph below and can be viewed by day.
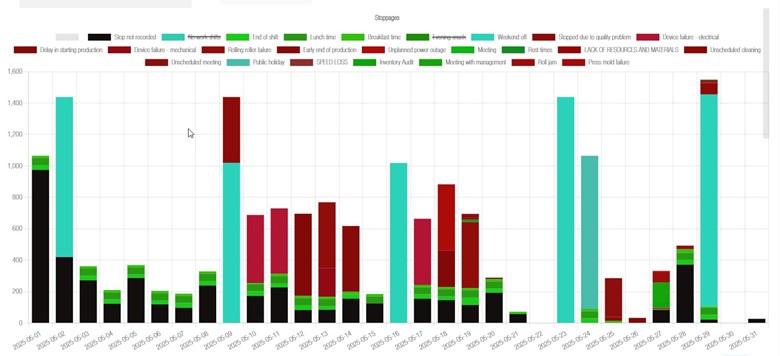
After filtering all factors, the black-colored category indicates the moments when the machine was idle but no reasons were recorded by the operator. For this machine, a total of 2,500 minutes of unrecorded stoppages occurred during August. Out of 31,000 total available minutes for the month, this corresponds to an 8% efficiency loss attributable to this issue.
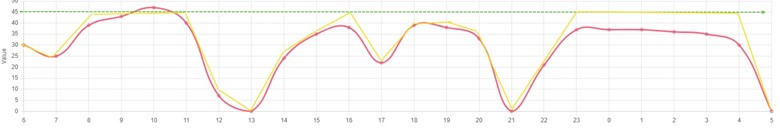
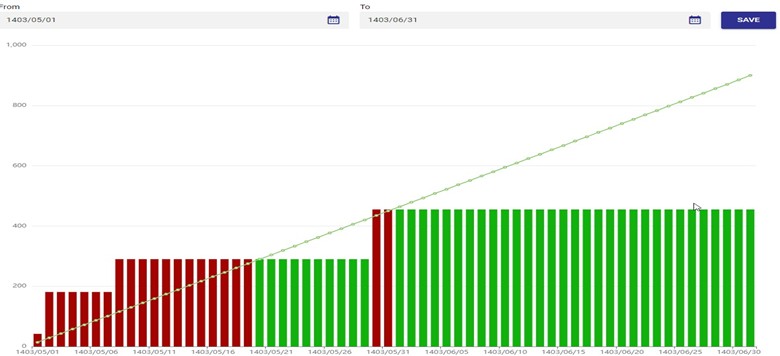
another factor contributing to the reduction in machine performance is speed loss. In the chart, the red line represents the machine’s current signal, the green line shows the nominal speed without downtime, and the yellow line indicates the target speed the machine should maintain. The integral of the area under the graph illustrates that 3% of the machine’s efficiency has been lost due to this reduction in performance.
As shown, from August 1 to August 31, the efficiency of machine CM 05 08 was measured at 72.84%, indicating a 13% potential for improvement, of which 11% is due to the aforementioned reasons.
11-Methods for Improving Production Efficiency
The next step after implementing this system is for the production and planning teams to analyze the different stoppage reasons, and to investigate the root causes using various methods. The system provides the ability to review stoppage reasons across different time periods and analyze them with approaches such as the 7 Tools of WCM to determine how stoppages can be reduced.
For instance, if through continuous training the production staff learn to fully record all stoppages and the unrecorded stoppages are reduced from 2,500 minutes to 1,500 minutes starting in April , then as shown, the efficiency of machine CM 05 08 would increase to 77%. At the same time, the effect of this improvement on the overall factory performance can also be observed.
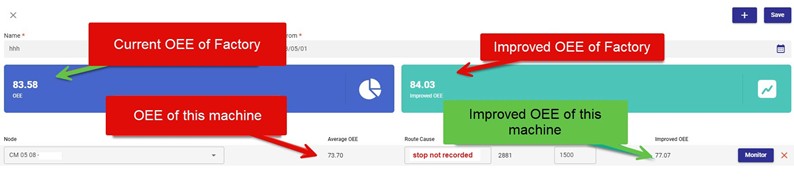
After that, we can track the impact of this improvement in September, meaning it can be observed whether the intended improvement is actually taking place or not
Another parameter is MTBS (Mean Time Between Stoppages), which refers to the average time between stoppages.
MTBS is a specific metric that focuses on the average interval between each stoppage (planned or unplanned) in the production process. This metric helps managers evaluate whether measures such as TPM and WCM have been effective in reducing stoppages.
For the two machines mentioned above, the MTBS is 2.5 hours, while the desirable level is around 3.5 hours.